Covid-19: Has lockdown worked?
COVID-19 – South Africa – Has lockdown worked?
(The short answer is YES. Read this to find out why and what next)
(Page Updated: 1 June 2020)
NATIONAL DISASTER
This page will unpack the statistical details surrounding Covid-19 in an effort to explain whether South Africa are doing well and why. Are there any warning signs we can read that will help you support the national effort to contain and overcome the threat to our economy and our people.
The country and the world have seen and experienced much turmoil and tribulation in the last 120 years. The influenza pandemic of 1918 infected an estimated 500 million people over 3 years in the midst of the first world war with 4 waves of infections killing an estimated 10 to 50 million people worldwide. South Africa were hard hit with an estimated 300,000 deaths.
It is difficult to comprehend the extent of such an outbreak and that it would even be possible today. In our modern era with information overload and many variations of the truth from both our history and what we see in front of us every day, it is apparently also exceedingly difficult to know whom to believe.
COVID-19
The harsh reality is that hundreds of thousands of people have already died in an unnatural manner and is traceable to the Coronavirus detected in December 2019 and codenamed “Covid-19”. In a matter of 40 days (or less) up to 15,000 people have died in countries where the contagion was contained too late – with Italy, France, United Kingdom and Spain the worst hit in Europe and the United States the worst worldwide.
While the debate may rage over the solutions and the accuracy of diagnosis, the reality remains that South Africa is a country with a largely poor health care system for the majority of the population. Our public transport facilities is wholly inadequate as a professional public service rendered to all our citizens. The urban and rural distribution of our population makes us particularly vulnerable to a contagious disease. South Africa cannot afford to fail her citizens in the manner we did in 1918.
INFECTIONS AND DEATH
At the start of level 3 phased opening of lockdown on 1 June 2020, South Africa had carried out testing to the extent that 34,357 people had been identified with the Covid-19 virus.
Tragically, 705 people had succumbed to the virus since 27 March 2020.
Our hearts and prayers go out to the families and friends who have lost loved ones with seemingly no justification.
FLATTENING THE CURVE
All the countries mentioned above have reached a measurable point of gaining control over the virus by reducing the rate by which citizens are dying every day.
This is in itself a measure of the tragedy that is upon us, when the leadership of a country deems the losses to be “an improvement”.
But yesterday (31 May 2020) 638 people died in the USA, 113 died in the UK and 75 died in Italy – These are the lowest death tolls in each country since 30 March 2020. For three countries losing 826 people, yesterday was a “better” day. But in figure 1, the daily death toll in these countries had been much higher and are reducing on a daily basis. Minimising the exposure and maximising available health care has resulted in the decrease.
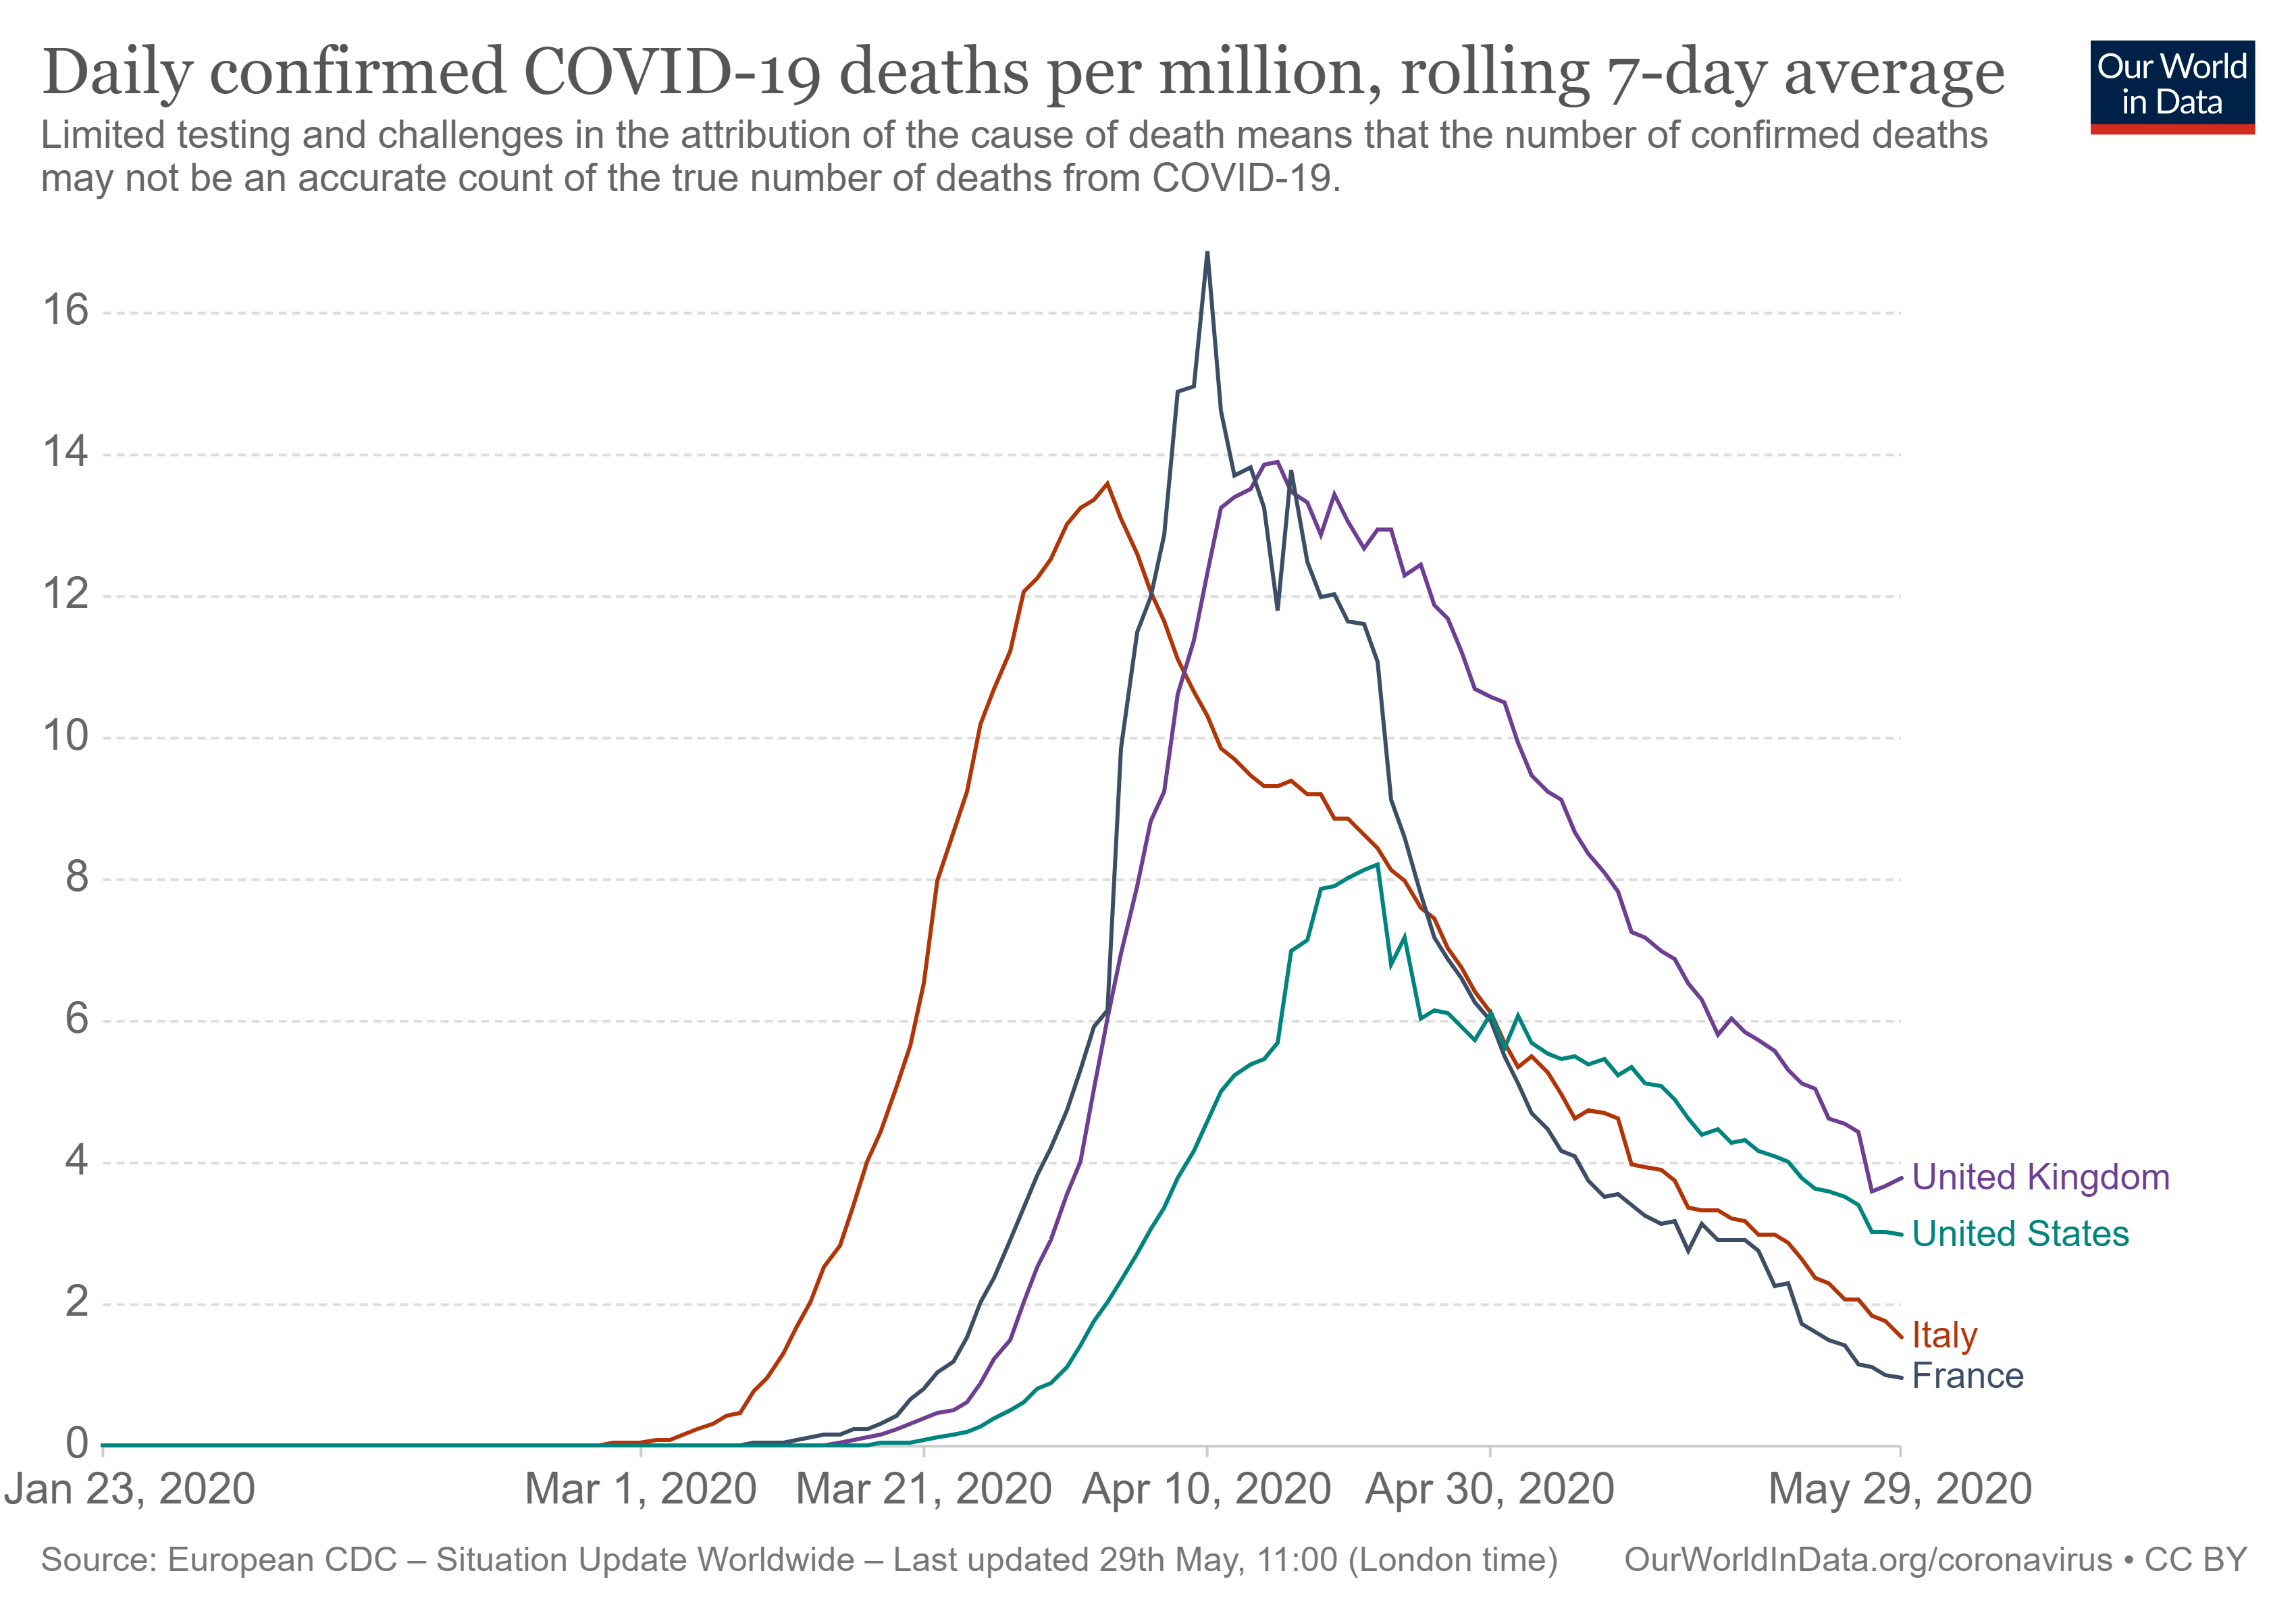
Figure 1: UK, USA, Italy, France flattening the curve (to 29 May)
In South Africa we lost 40 people yesterday. We have to know whether our losses are going to go up. Where are we really on “flattening the curve”?
I am emphasising the deaths here because the number of confirmed cases are dependent on whether the person has been tested. Therefore the accuracy of the number of confirmed cases will improve as governance works harder and more focused on responding to the demand.
“ASYMPTOMATIC”
What is this? It is our biggest threat. The Covid-19 can spread without you knowing you are infected. In other words, you have no symptoms of being sick and you think you are well. You therefore believe that you can continue working. With Covid-19 you only start experiencing feelings of being sick, days after being infected.
So how do we count how many people are infected if we do not know who is infected? How do you protect yourself and your family if you do not know who is infected? This is the challenge that the Health Care leaders of our country are facing.
It is also possible to be tested today and you are healthy and tomorrow you interact with someone who is infected, and you become sick – meaning that the test result is no longer valid.
NO LOCKDOWN
Brazil and Sweden were two countries, for different reasons, did not apply stringent or coherent lockdowns.
Sweden elected to encourage social distancing and limit large gatherings but took no further compulsory measures to contain the contagion. For Sweden it was effectively “business as usual” with regard to compliance.
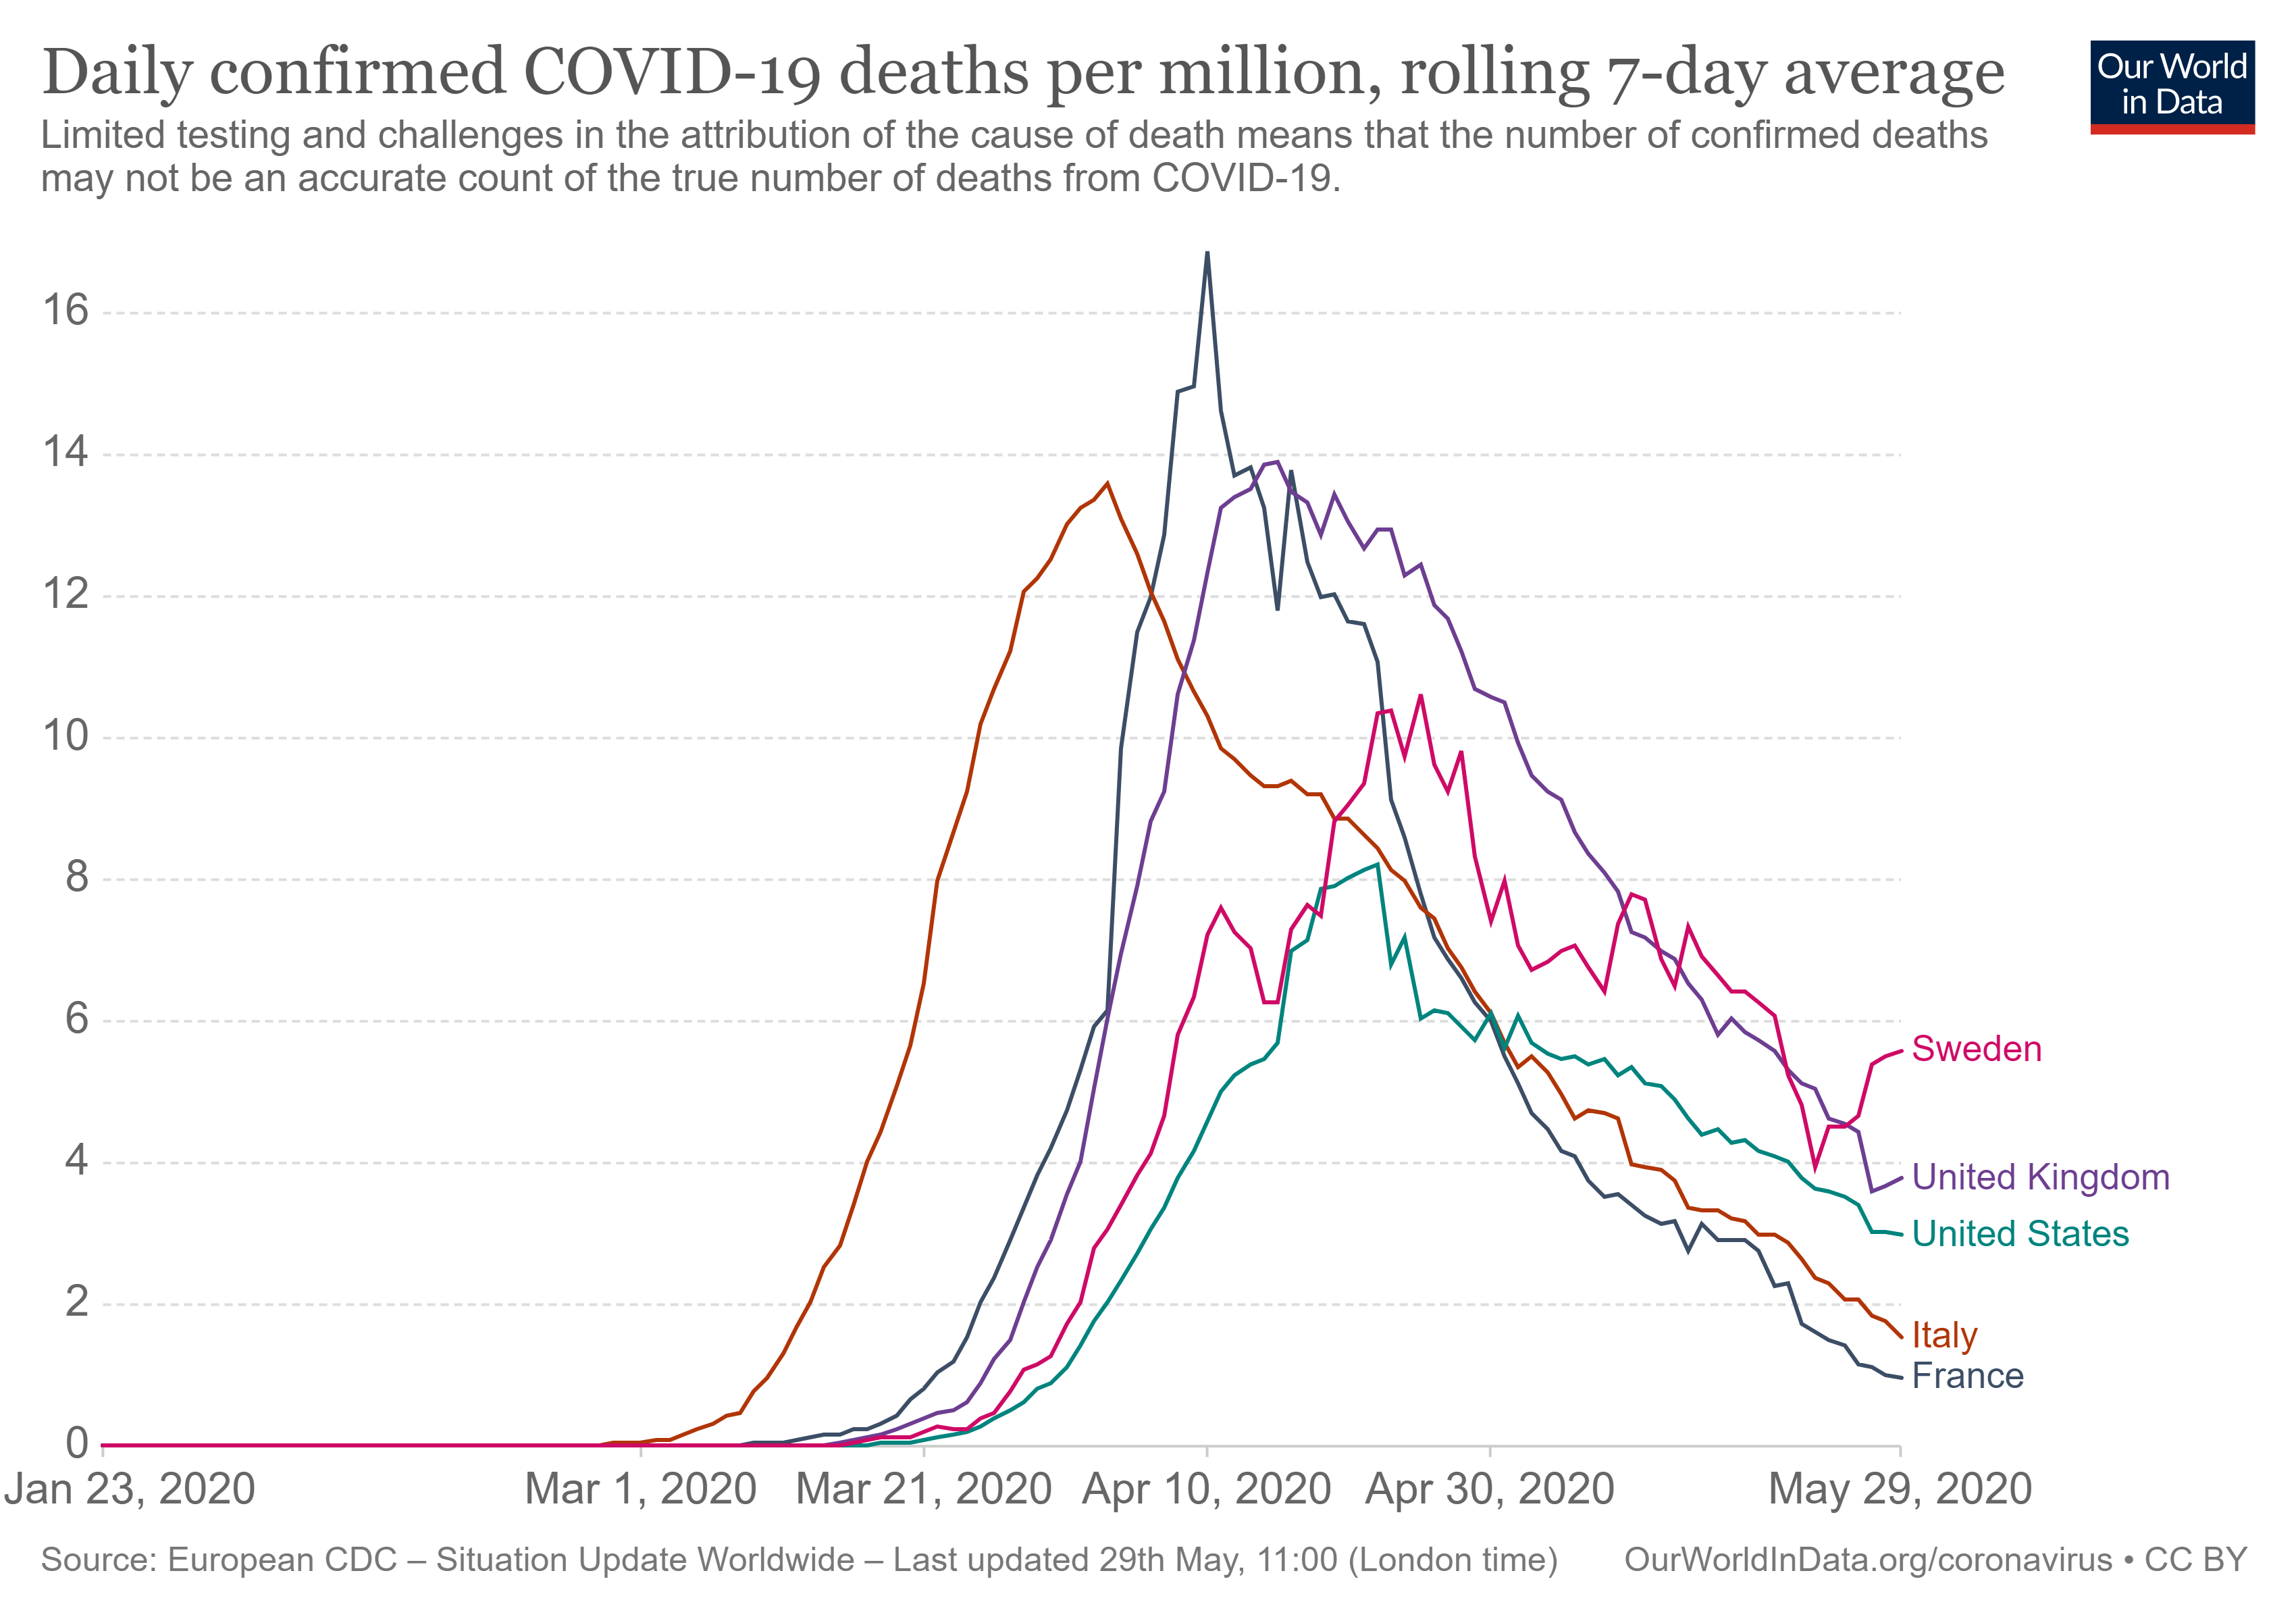
Figure 2: Swedish success (or not) with managing Covid-19
As at 29 May 2020, Sweden have a higher average daily death toll (per million people in their population) than the worst hit countries who applied some form of formal lockdown. Total death toll: 4395 (31 May).
Brazil allowed their weak and arrogant leader to undermine the authority of their health care specialists. Brazil now have the second highest infections in the world and share the highest daily death toll with the USA.
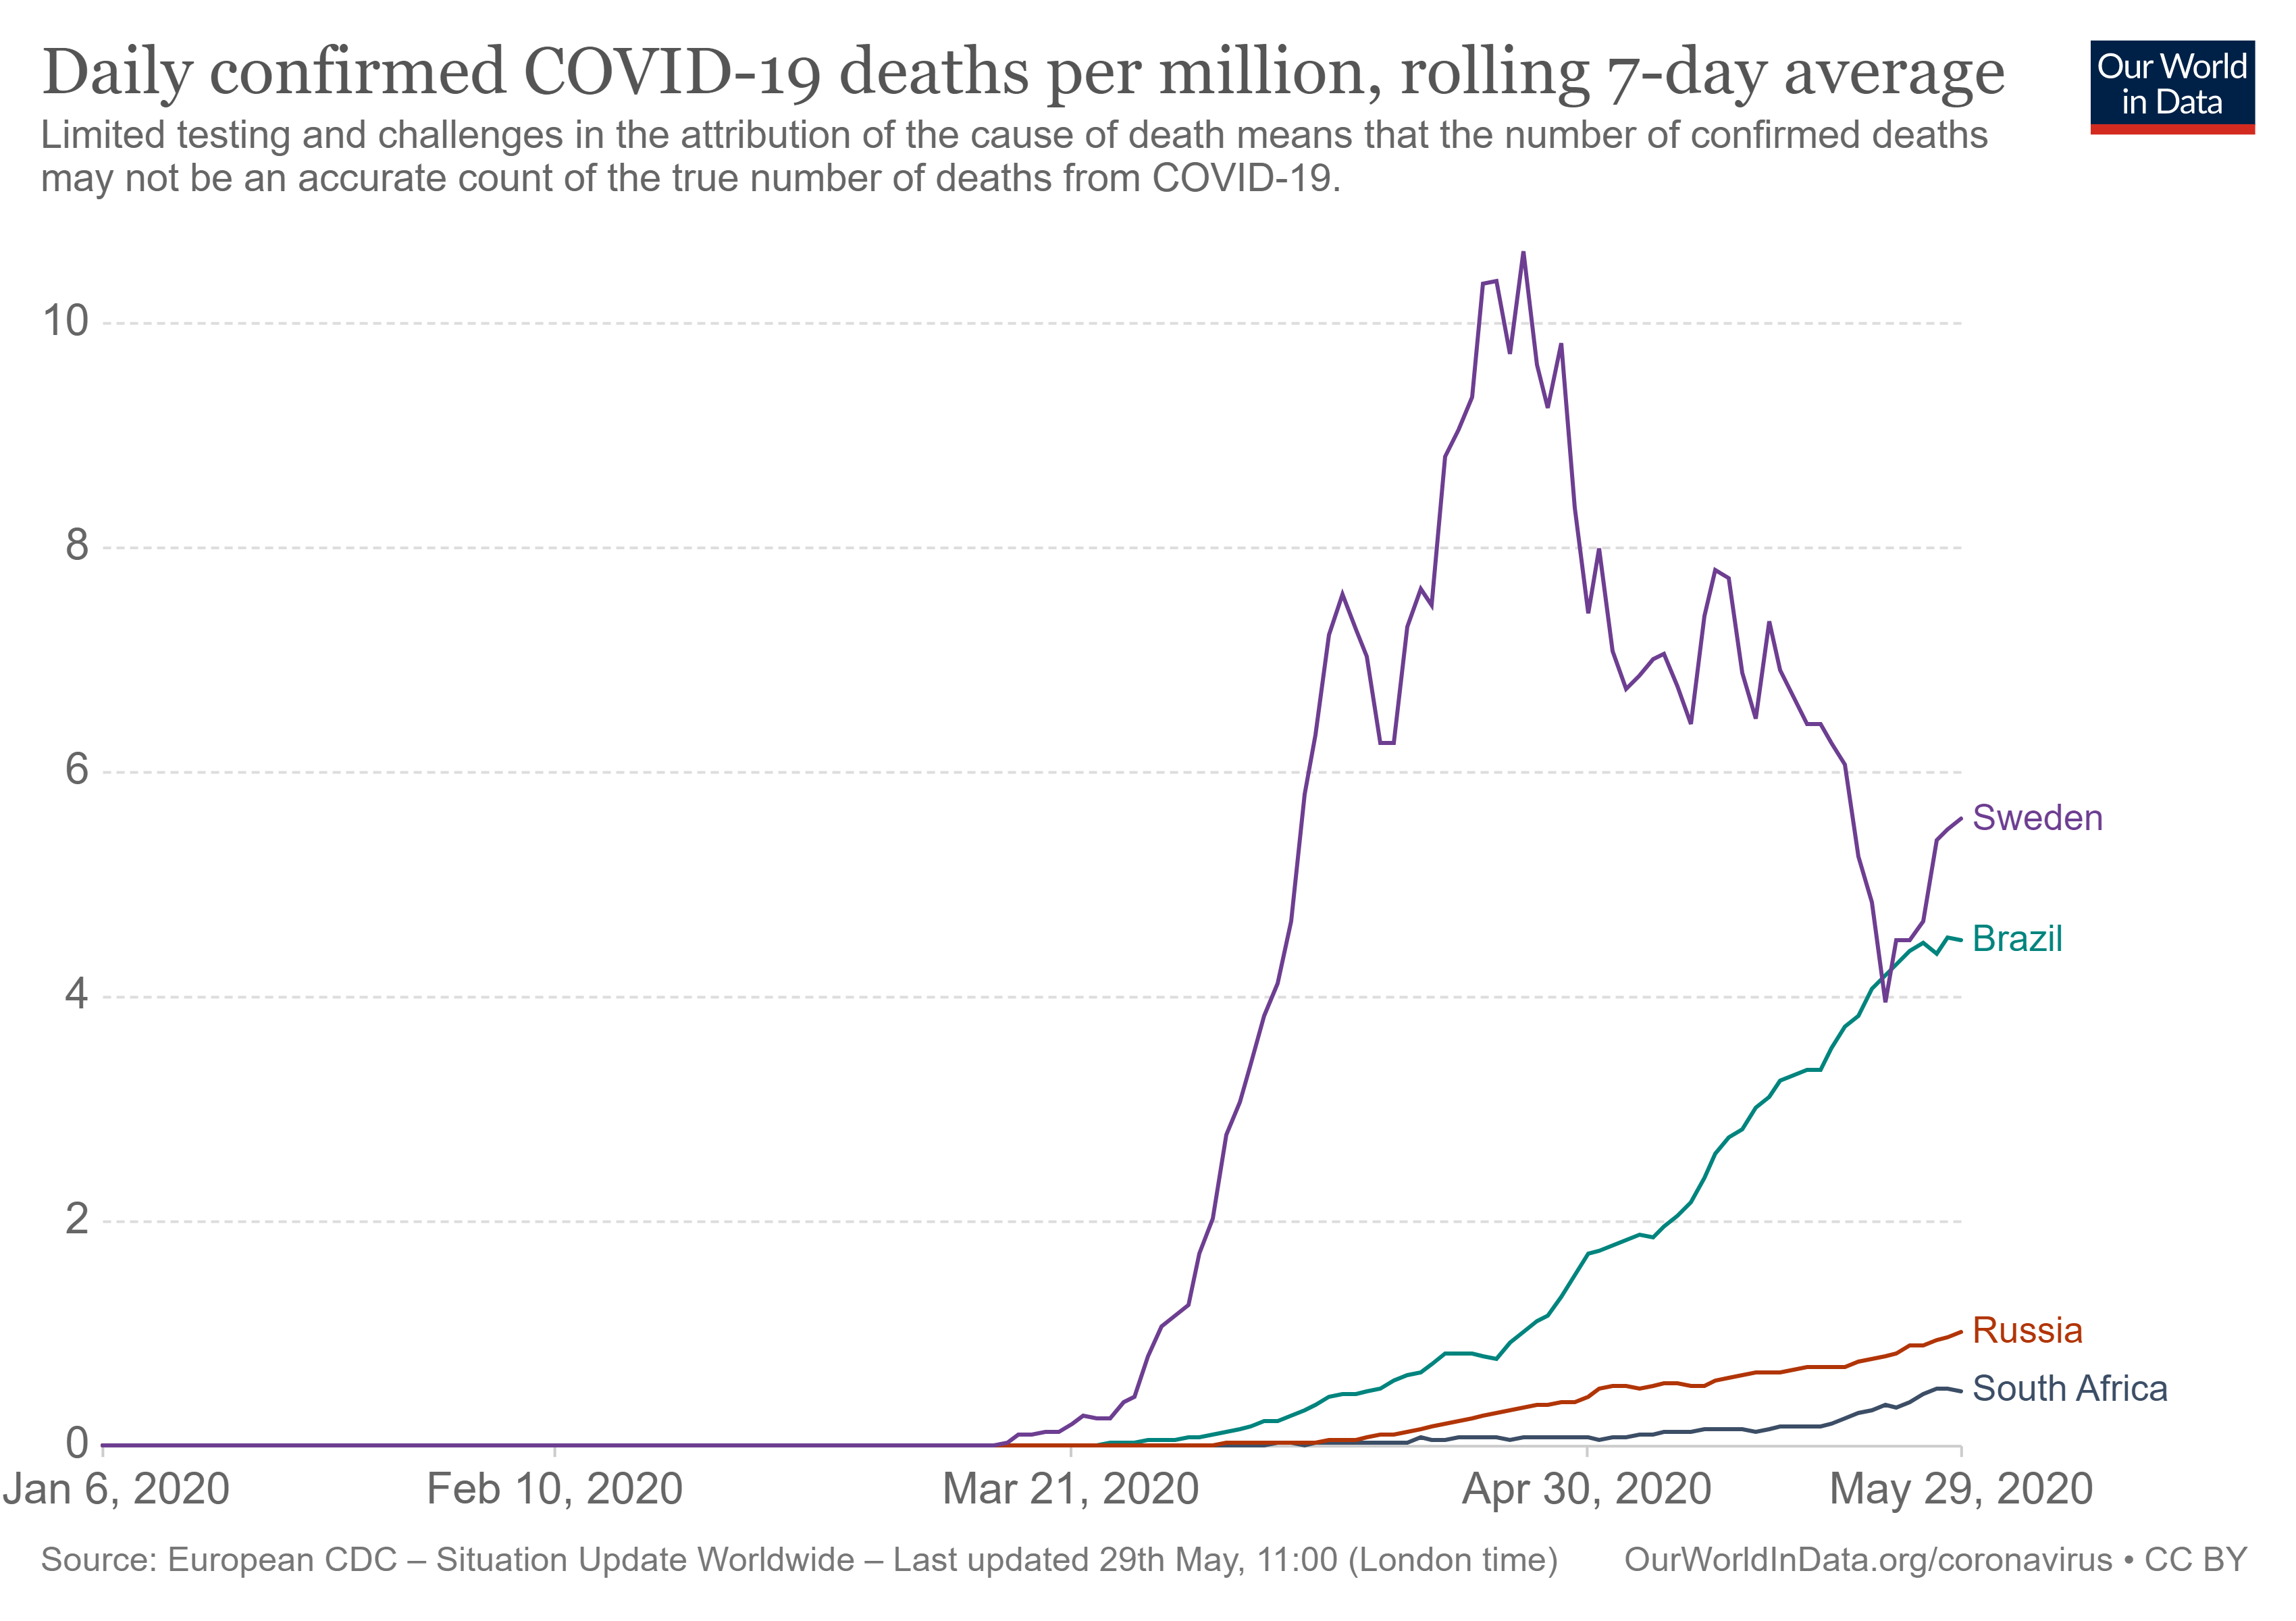
Figure 3: Countries comparison - not yet flattening the curve
To fully understand the consequences of poor leadership, the loss of every person must be acknowledged as a tragedy. In Brazil, the “curve” is still climbing.
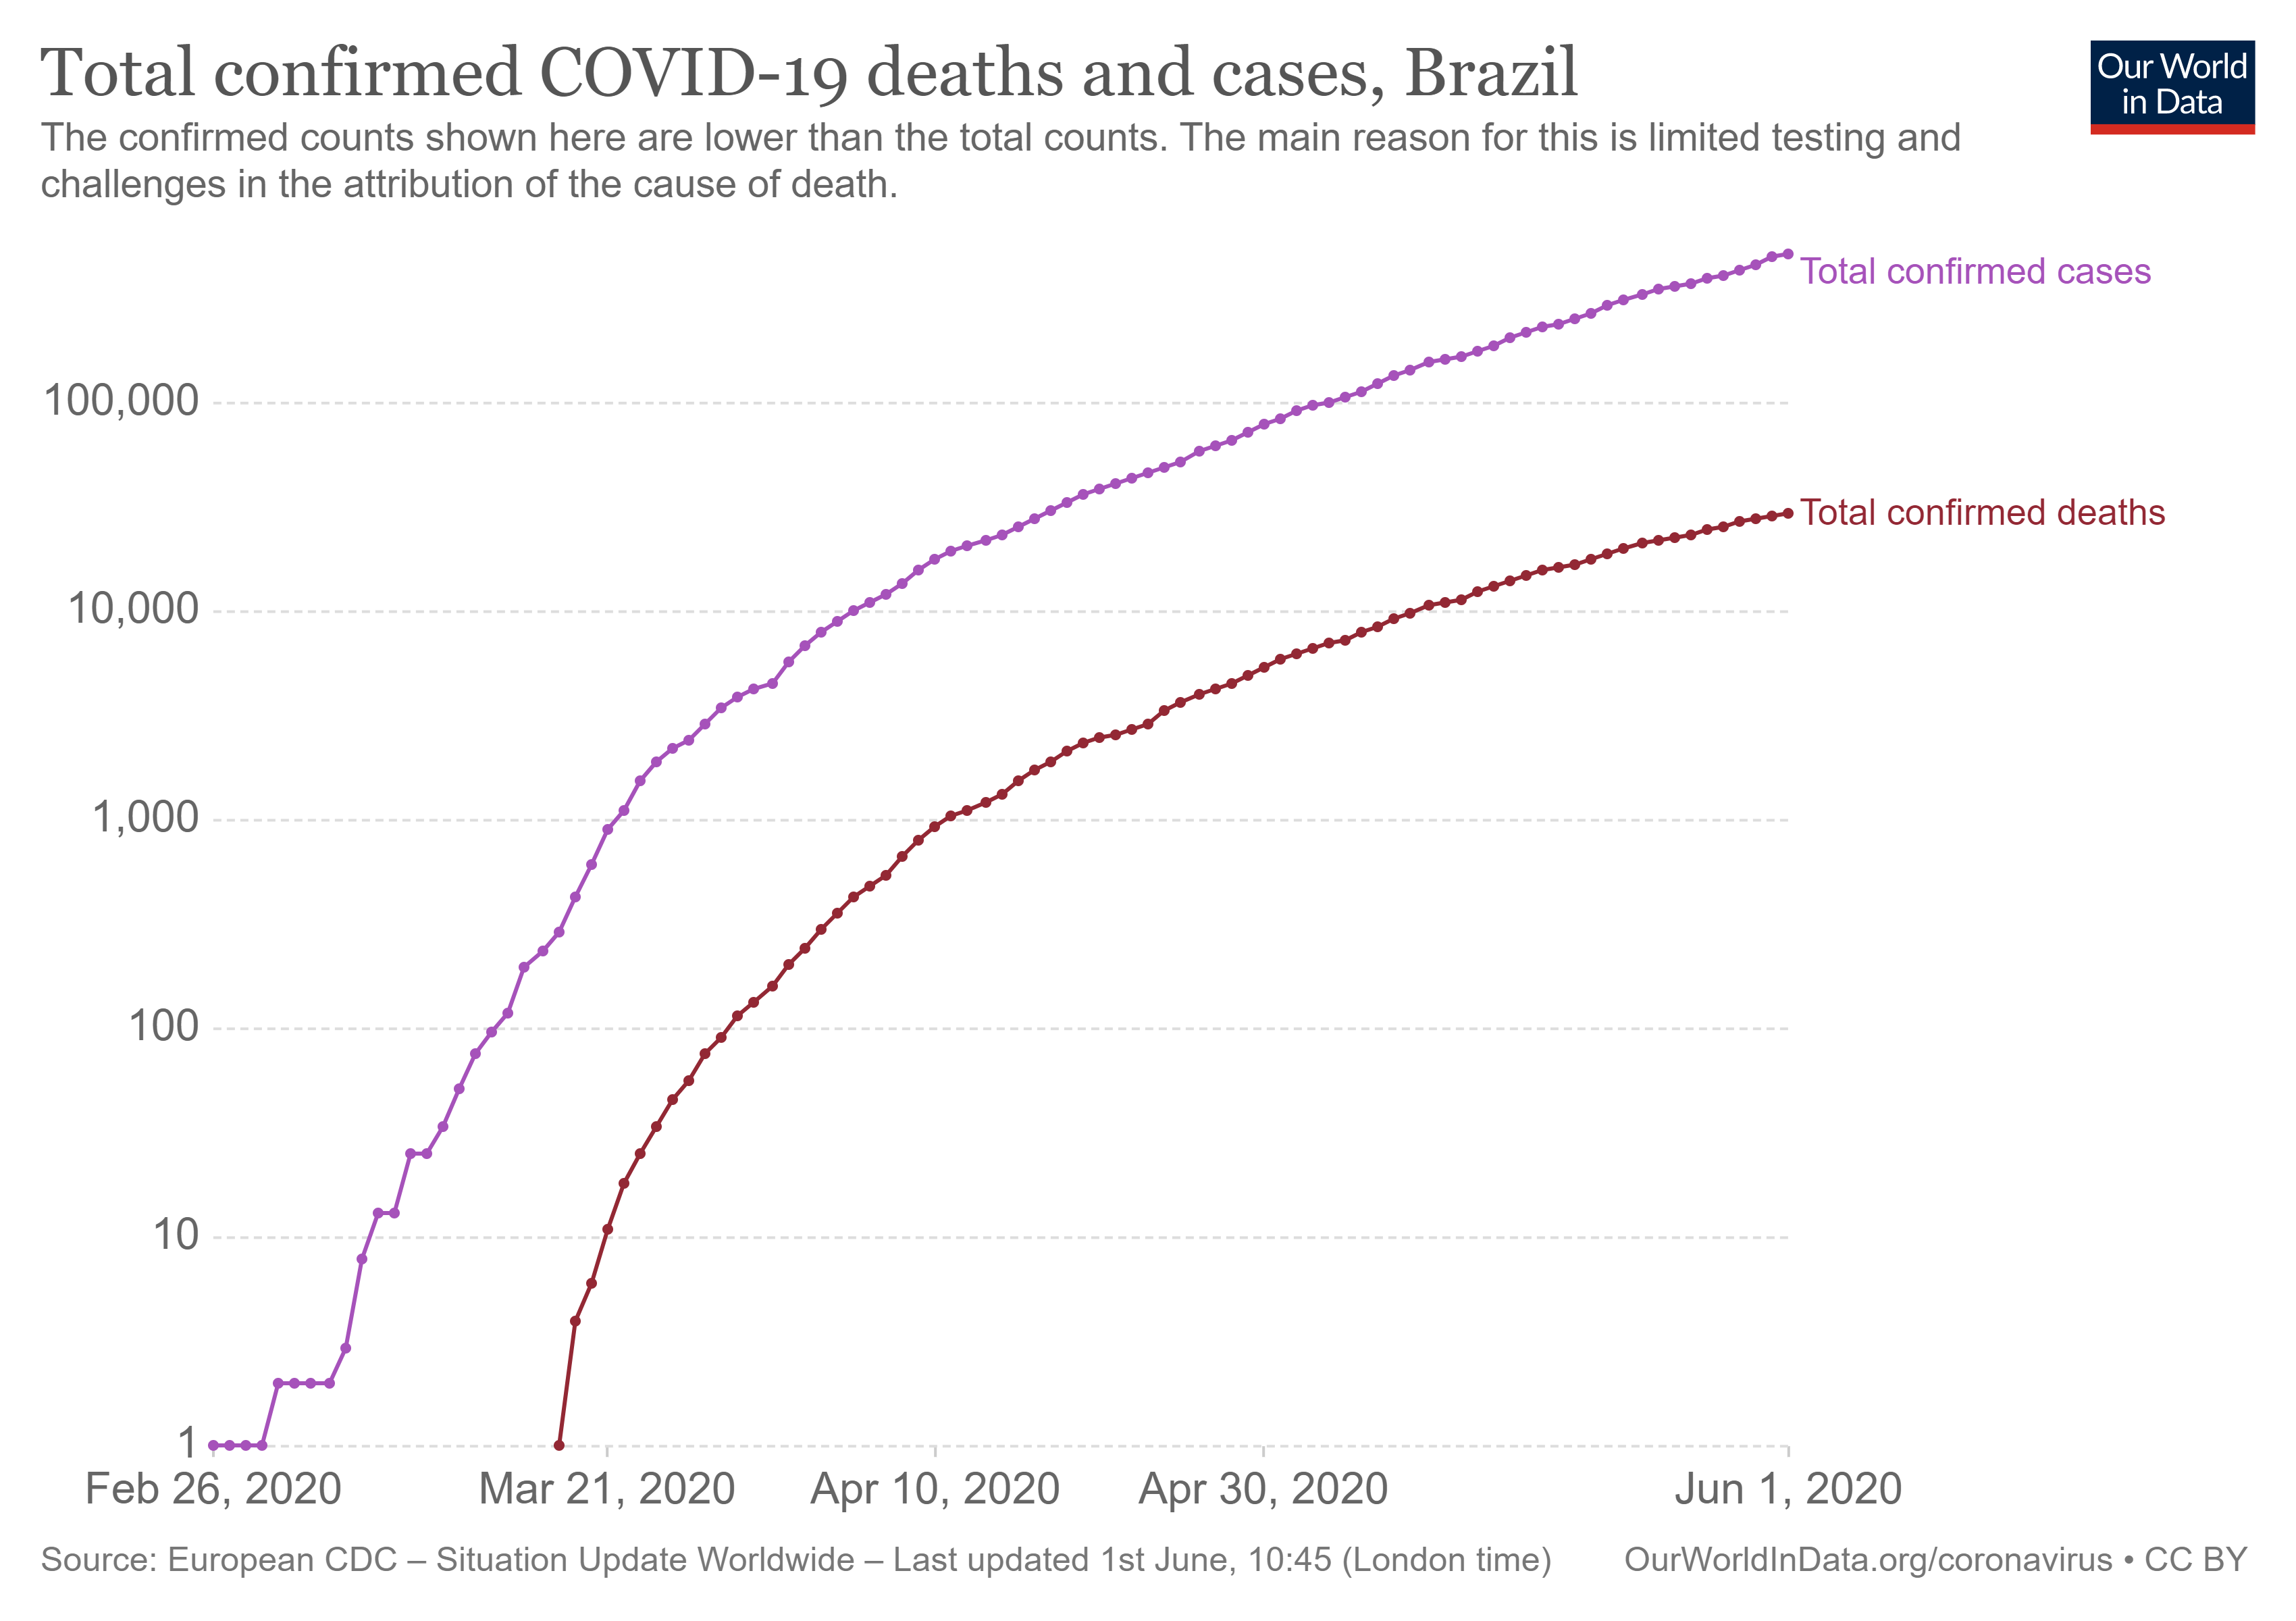
Figure 4: Brazil Covid-19 in full force
The Brazil health care system has surpassed the state of collapse and the frontline workers in every part of their economy is stretched. Brazil no longer have any control and find themselves at the mercy of Covid-19.
By contrast, despite the enormous loss of life experienced in Italy, their stringent actions to lockdown the country has finally achieved success. In the figure below (figure 5) the “log graph” shows that the increases are tapering off to a flat line. The citizens of Italy have suffered tremendous tragedy but it is coming to an end. This is not so for Brazil with pain and suffering set to continue.
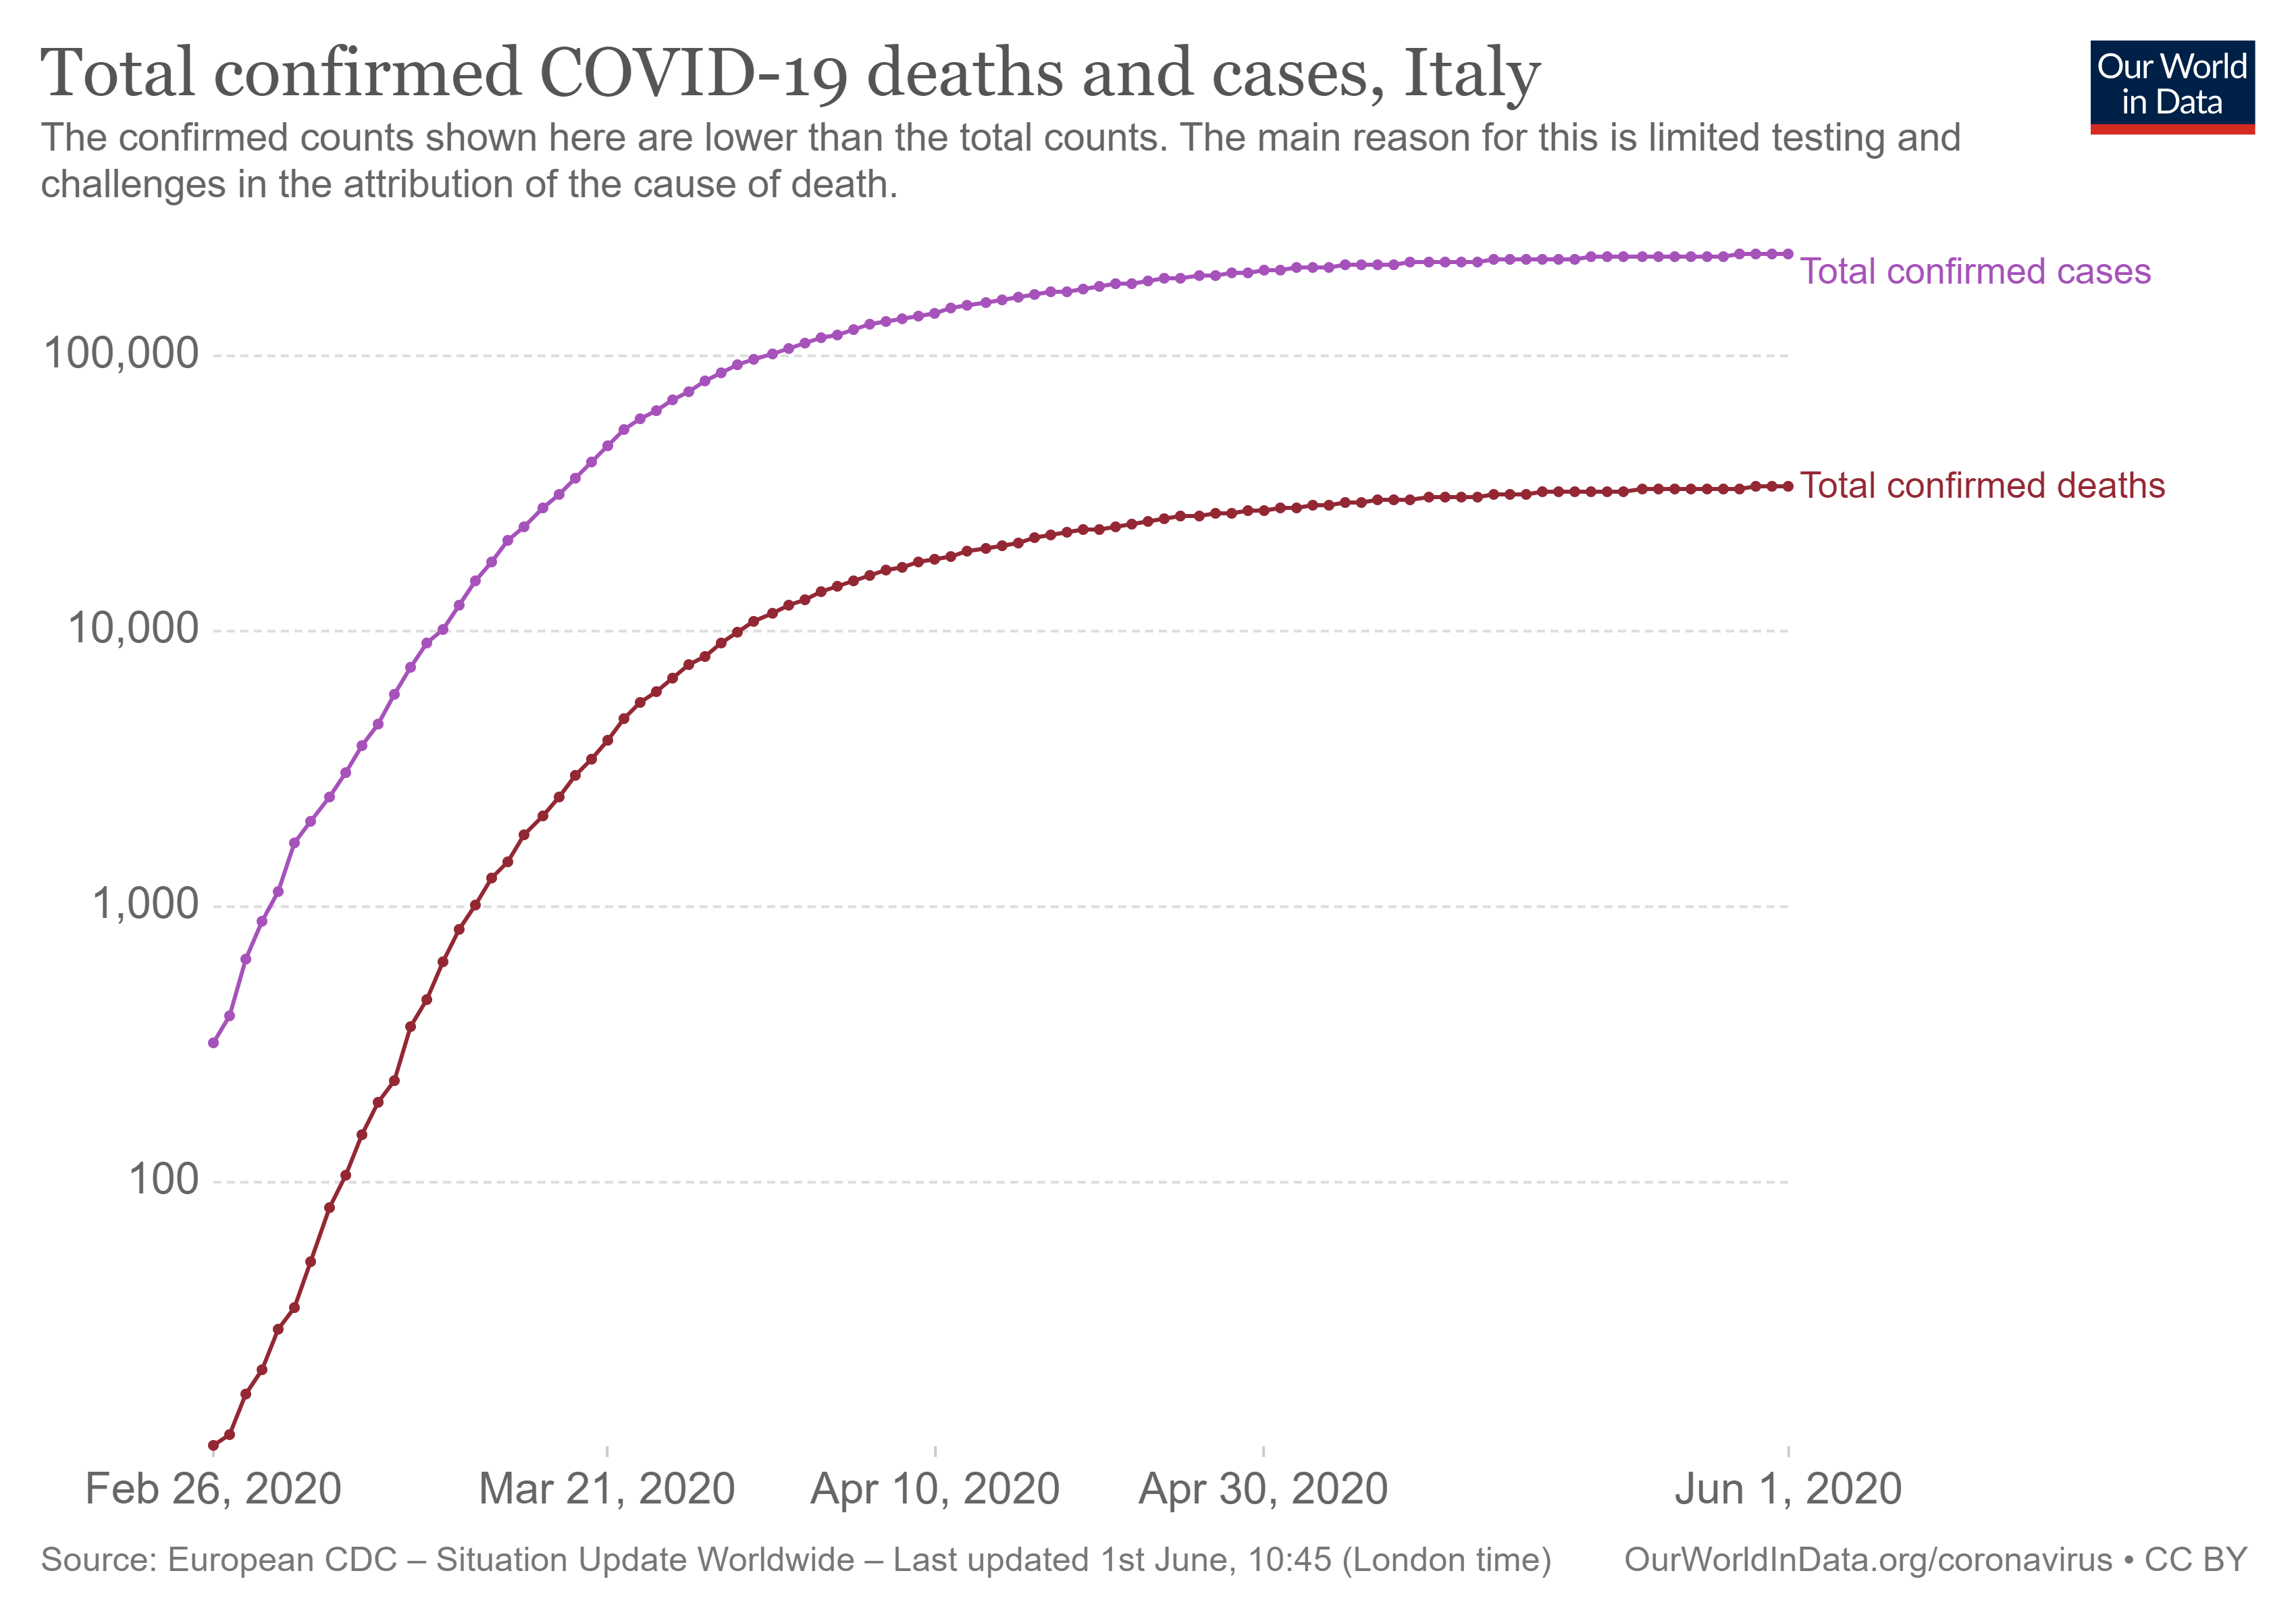
Figure 5: Italy Covid-19 1st wave flattened
SOUTH AFRICA LOCKDOWN
South Africa acted judiciously and unanimously as a nation to block the spread of the virus by locking down on 27 March 2020.
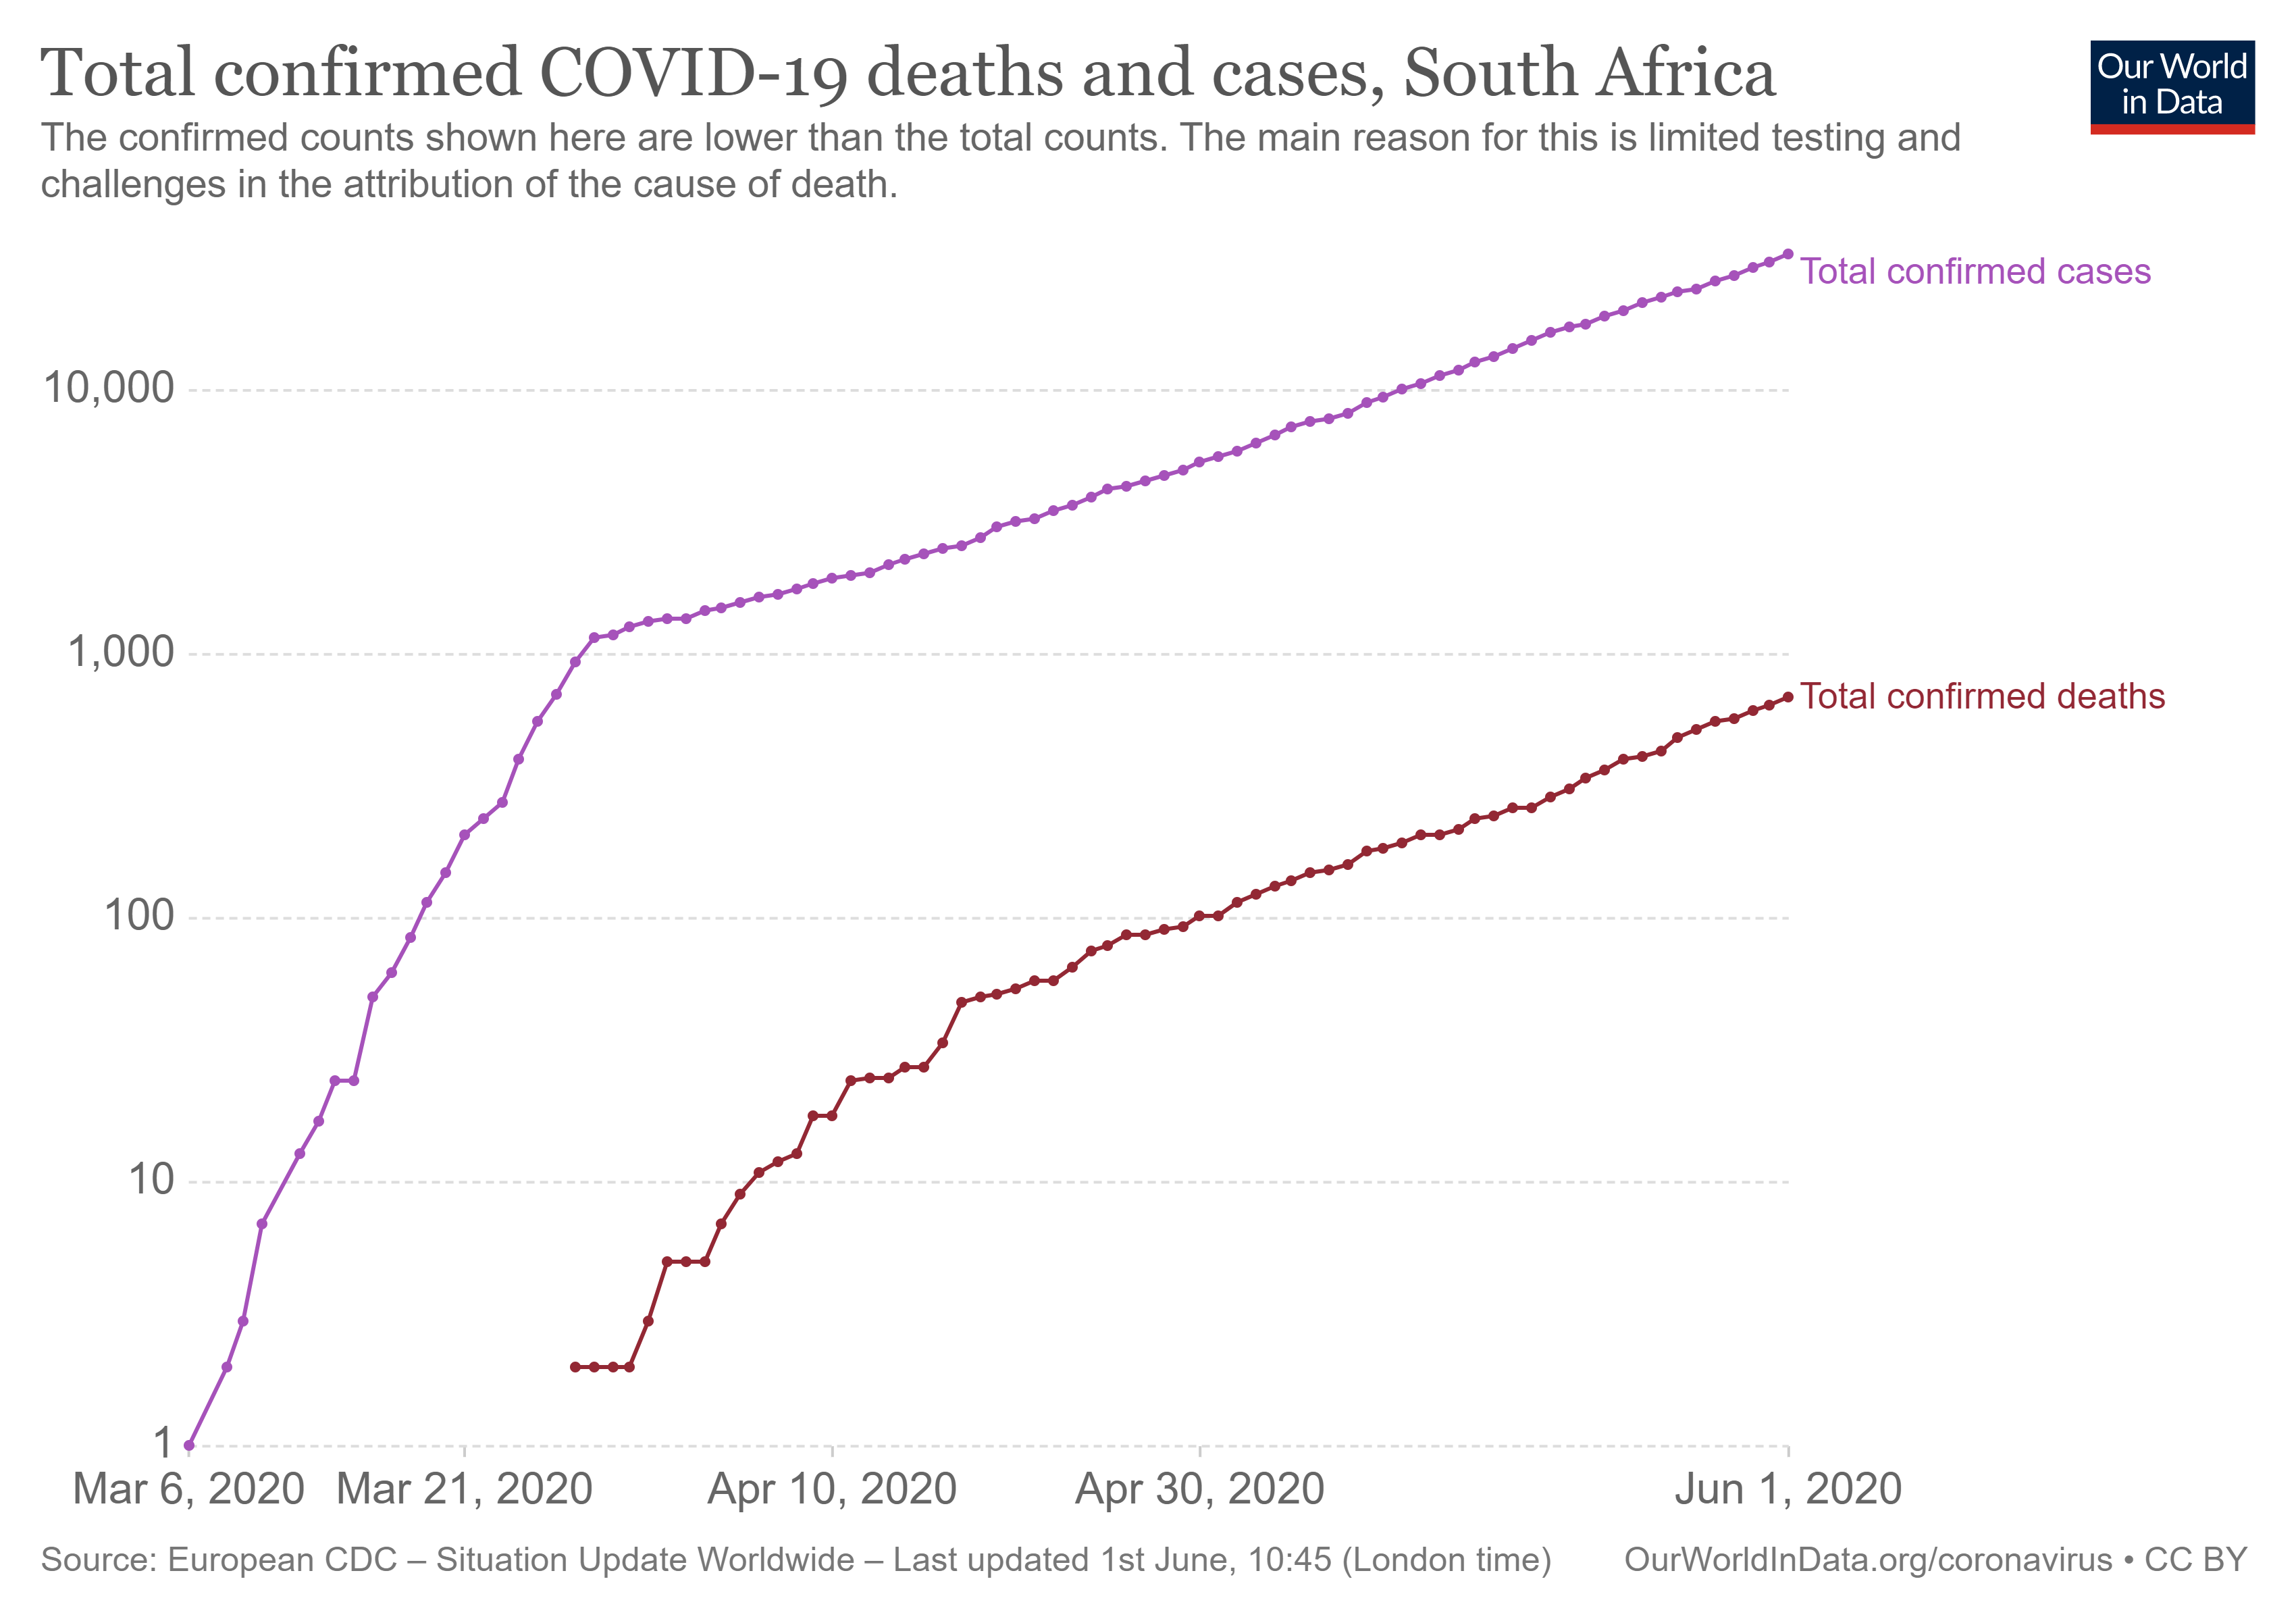
Figure 6: South Africa locked down, infections and deaths (on log scale) ``Curve`` not flattened yet
The result? The contagion rate of infection (“confirmed cases”) immediately reduced as can be seen by the bend in the confirmed cases graph in figure 6, from 29 March onwards.
The rate with which South Africans have been dying from this virus is also shown in figure 6. There is a delay between being infected and death and the same change in rate can be seen from mid-April. The rate has followed (meaning equal) the increase in the number of infected people. Therefore the lower the infection (confirmed cases) rate, the lower the deaths.
But confirmed cases are dependent on 2 things:
1. People must be tested (to be able to truthfully report confirmed cases); and
2. People must remain protected.
Under lockdown conditions, the second part was being fulfilled. People remain protected if they cannot and do not spread the virus.
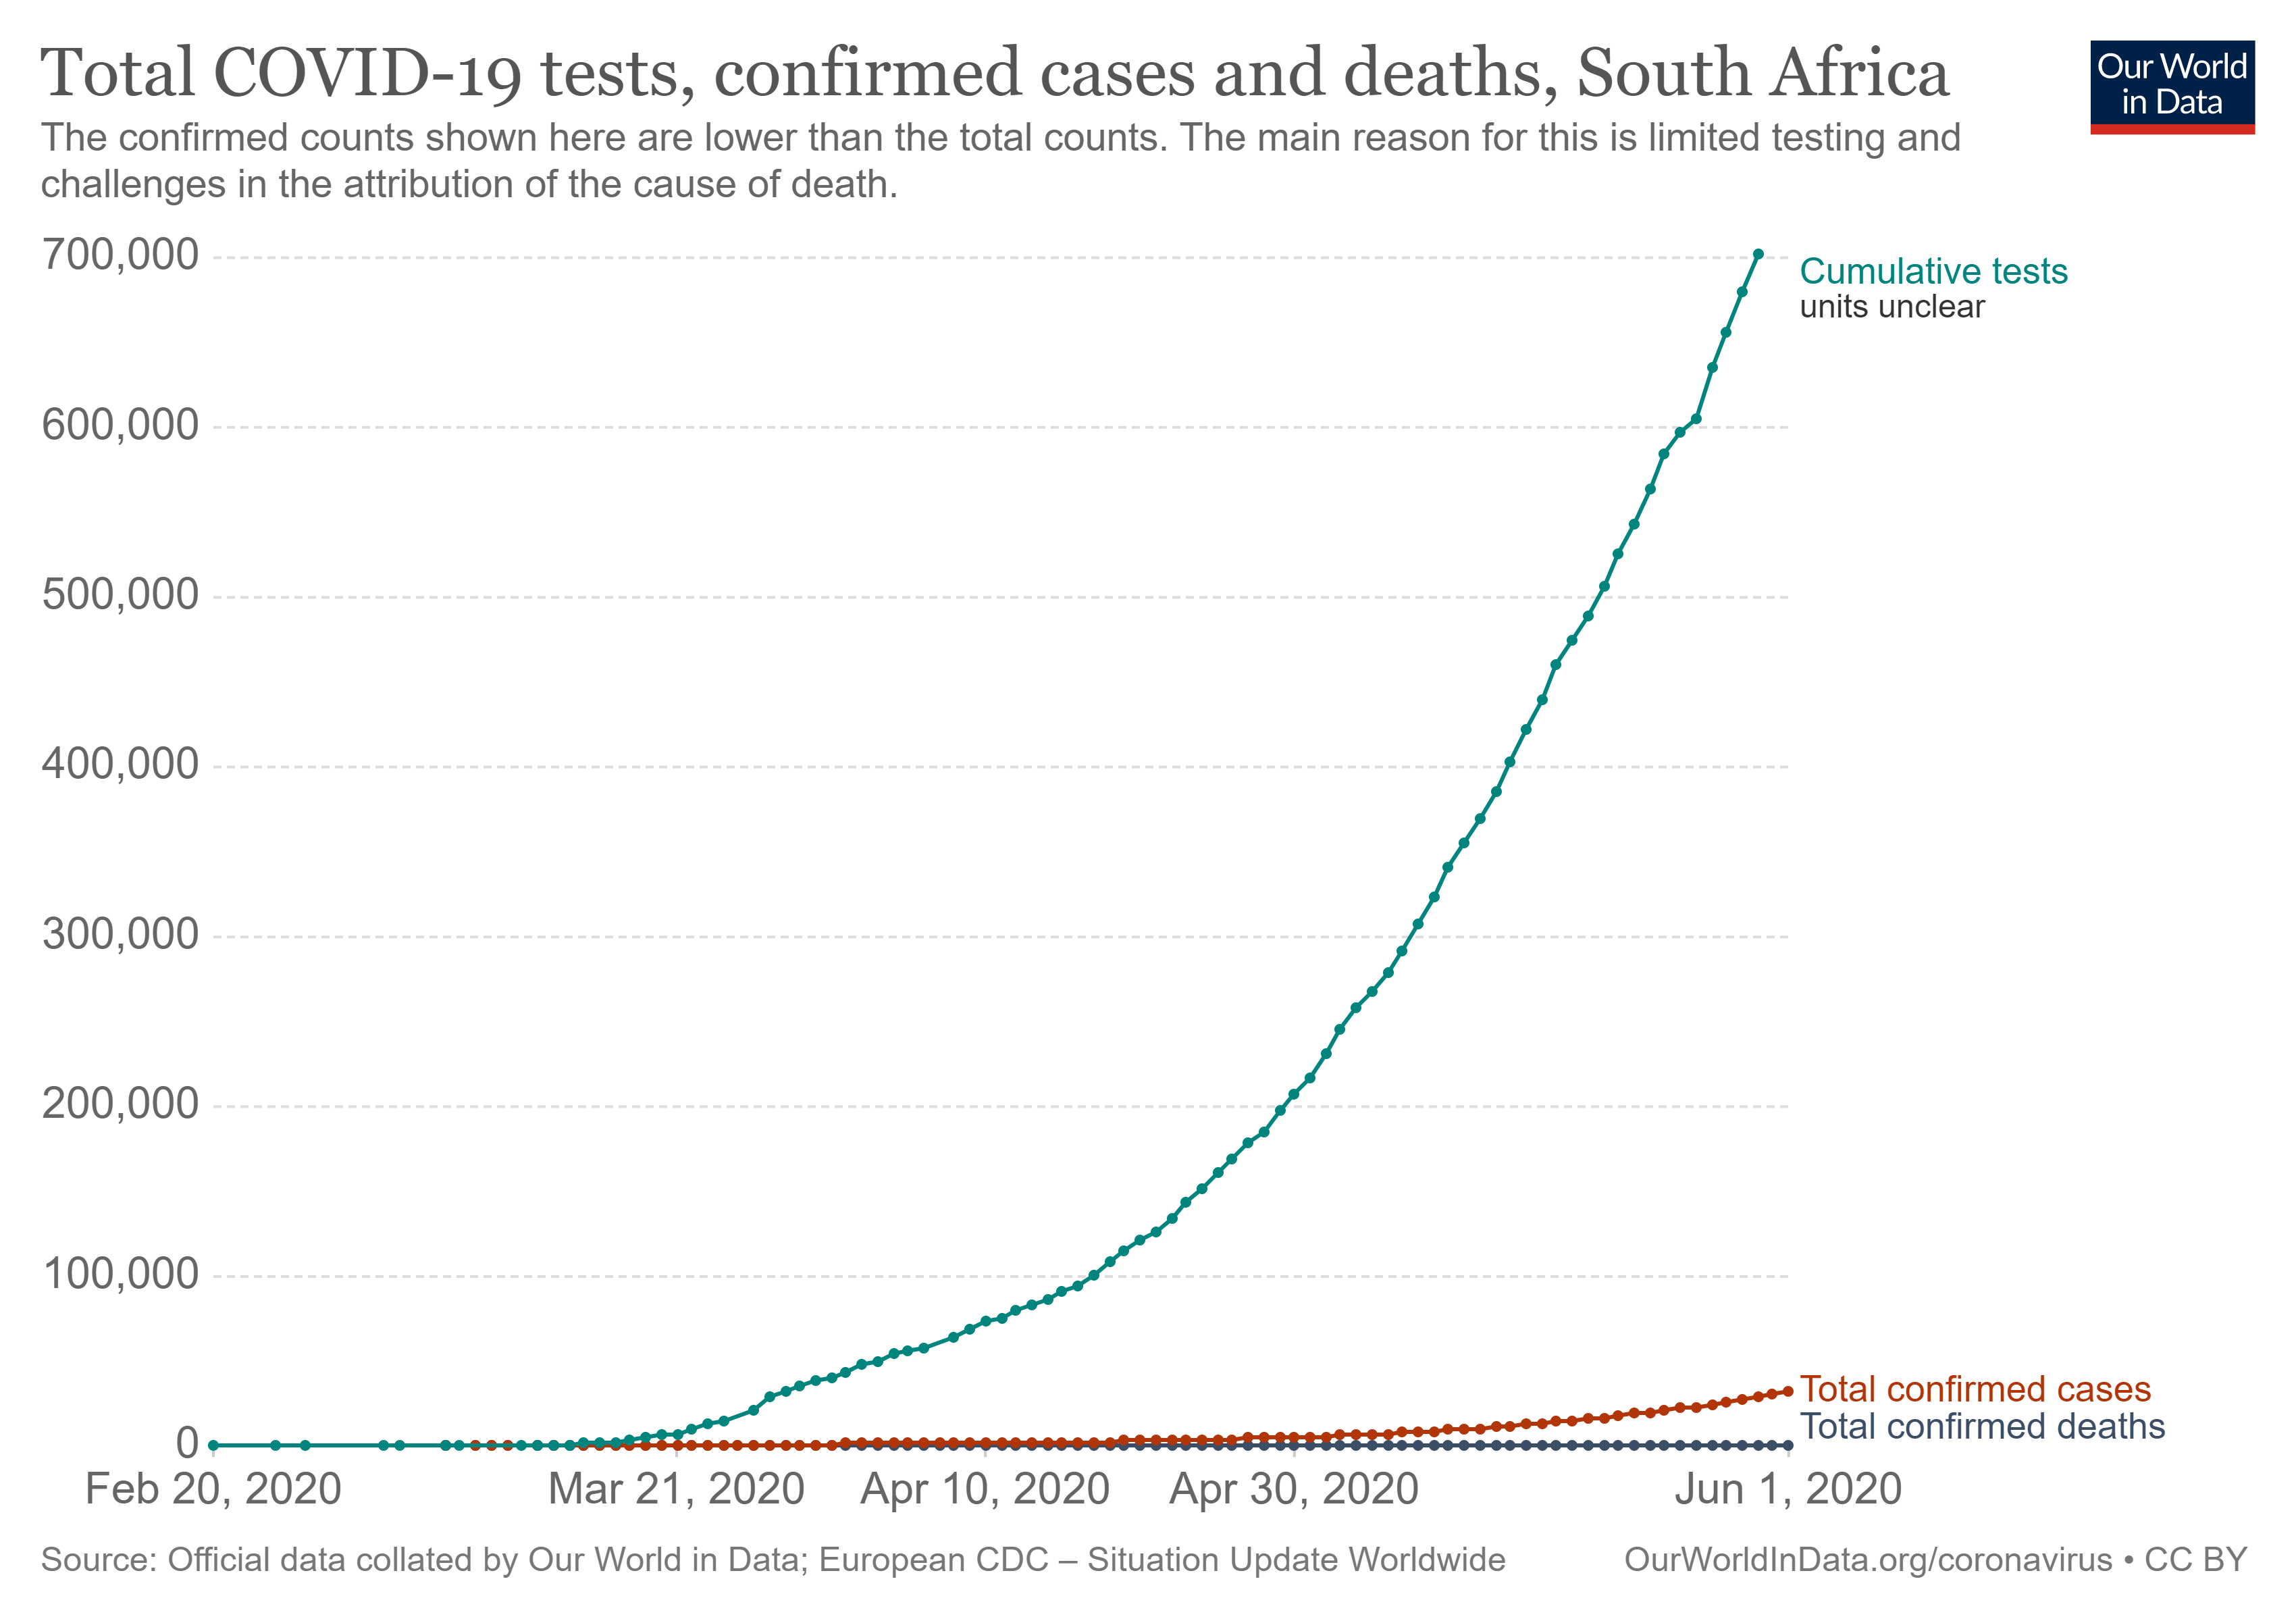
Figure 7: South Africa tests and cases (on linear scale)
Testing has been increased and more needs to be done. But the tests are only good if the citizens of South Africa remain protected. After being tested negative (not infected), they must continue to diligently avoid being infected.
HAVE SOUTH AFRICA GAINED FROM LOCKDOWN?
Compare to Sweden
Without lockdown (no compulsory lockdown measures), South Africa would have (at best) followed the experiences of Sweden. Sweden has a much smaller population than South Africa (1/6th ) and therefore results are multiplied accordingly for the larger South African population.
Extrapolating the Swedish results to South Africa after 57 days since the first death occurred:
SWEDEN EQUIVALENT DEATHS IN SOUTH AFRICA: 21,426 people would have died.
ACTUAL DEATHS IN SOUTH AFRICA: 582 South Africans had died.
Therefore, the lockdown measures has helped save more than 20,000 lives in South Africa in less than 2 months.
Compare to Colombia
Colombia, on the continent of South America, is similar to South Africa in
* Population,
* Population density and
* Socio economic stresses.
Colombia also applied a lockdown.
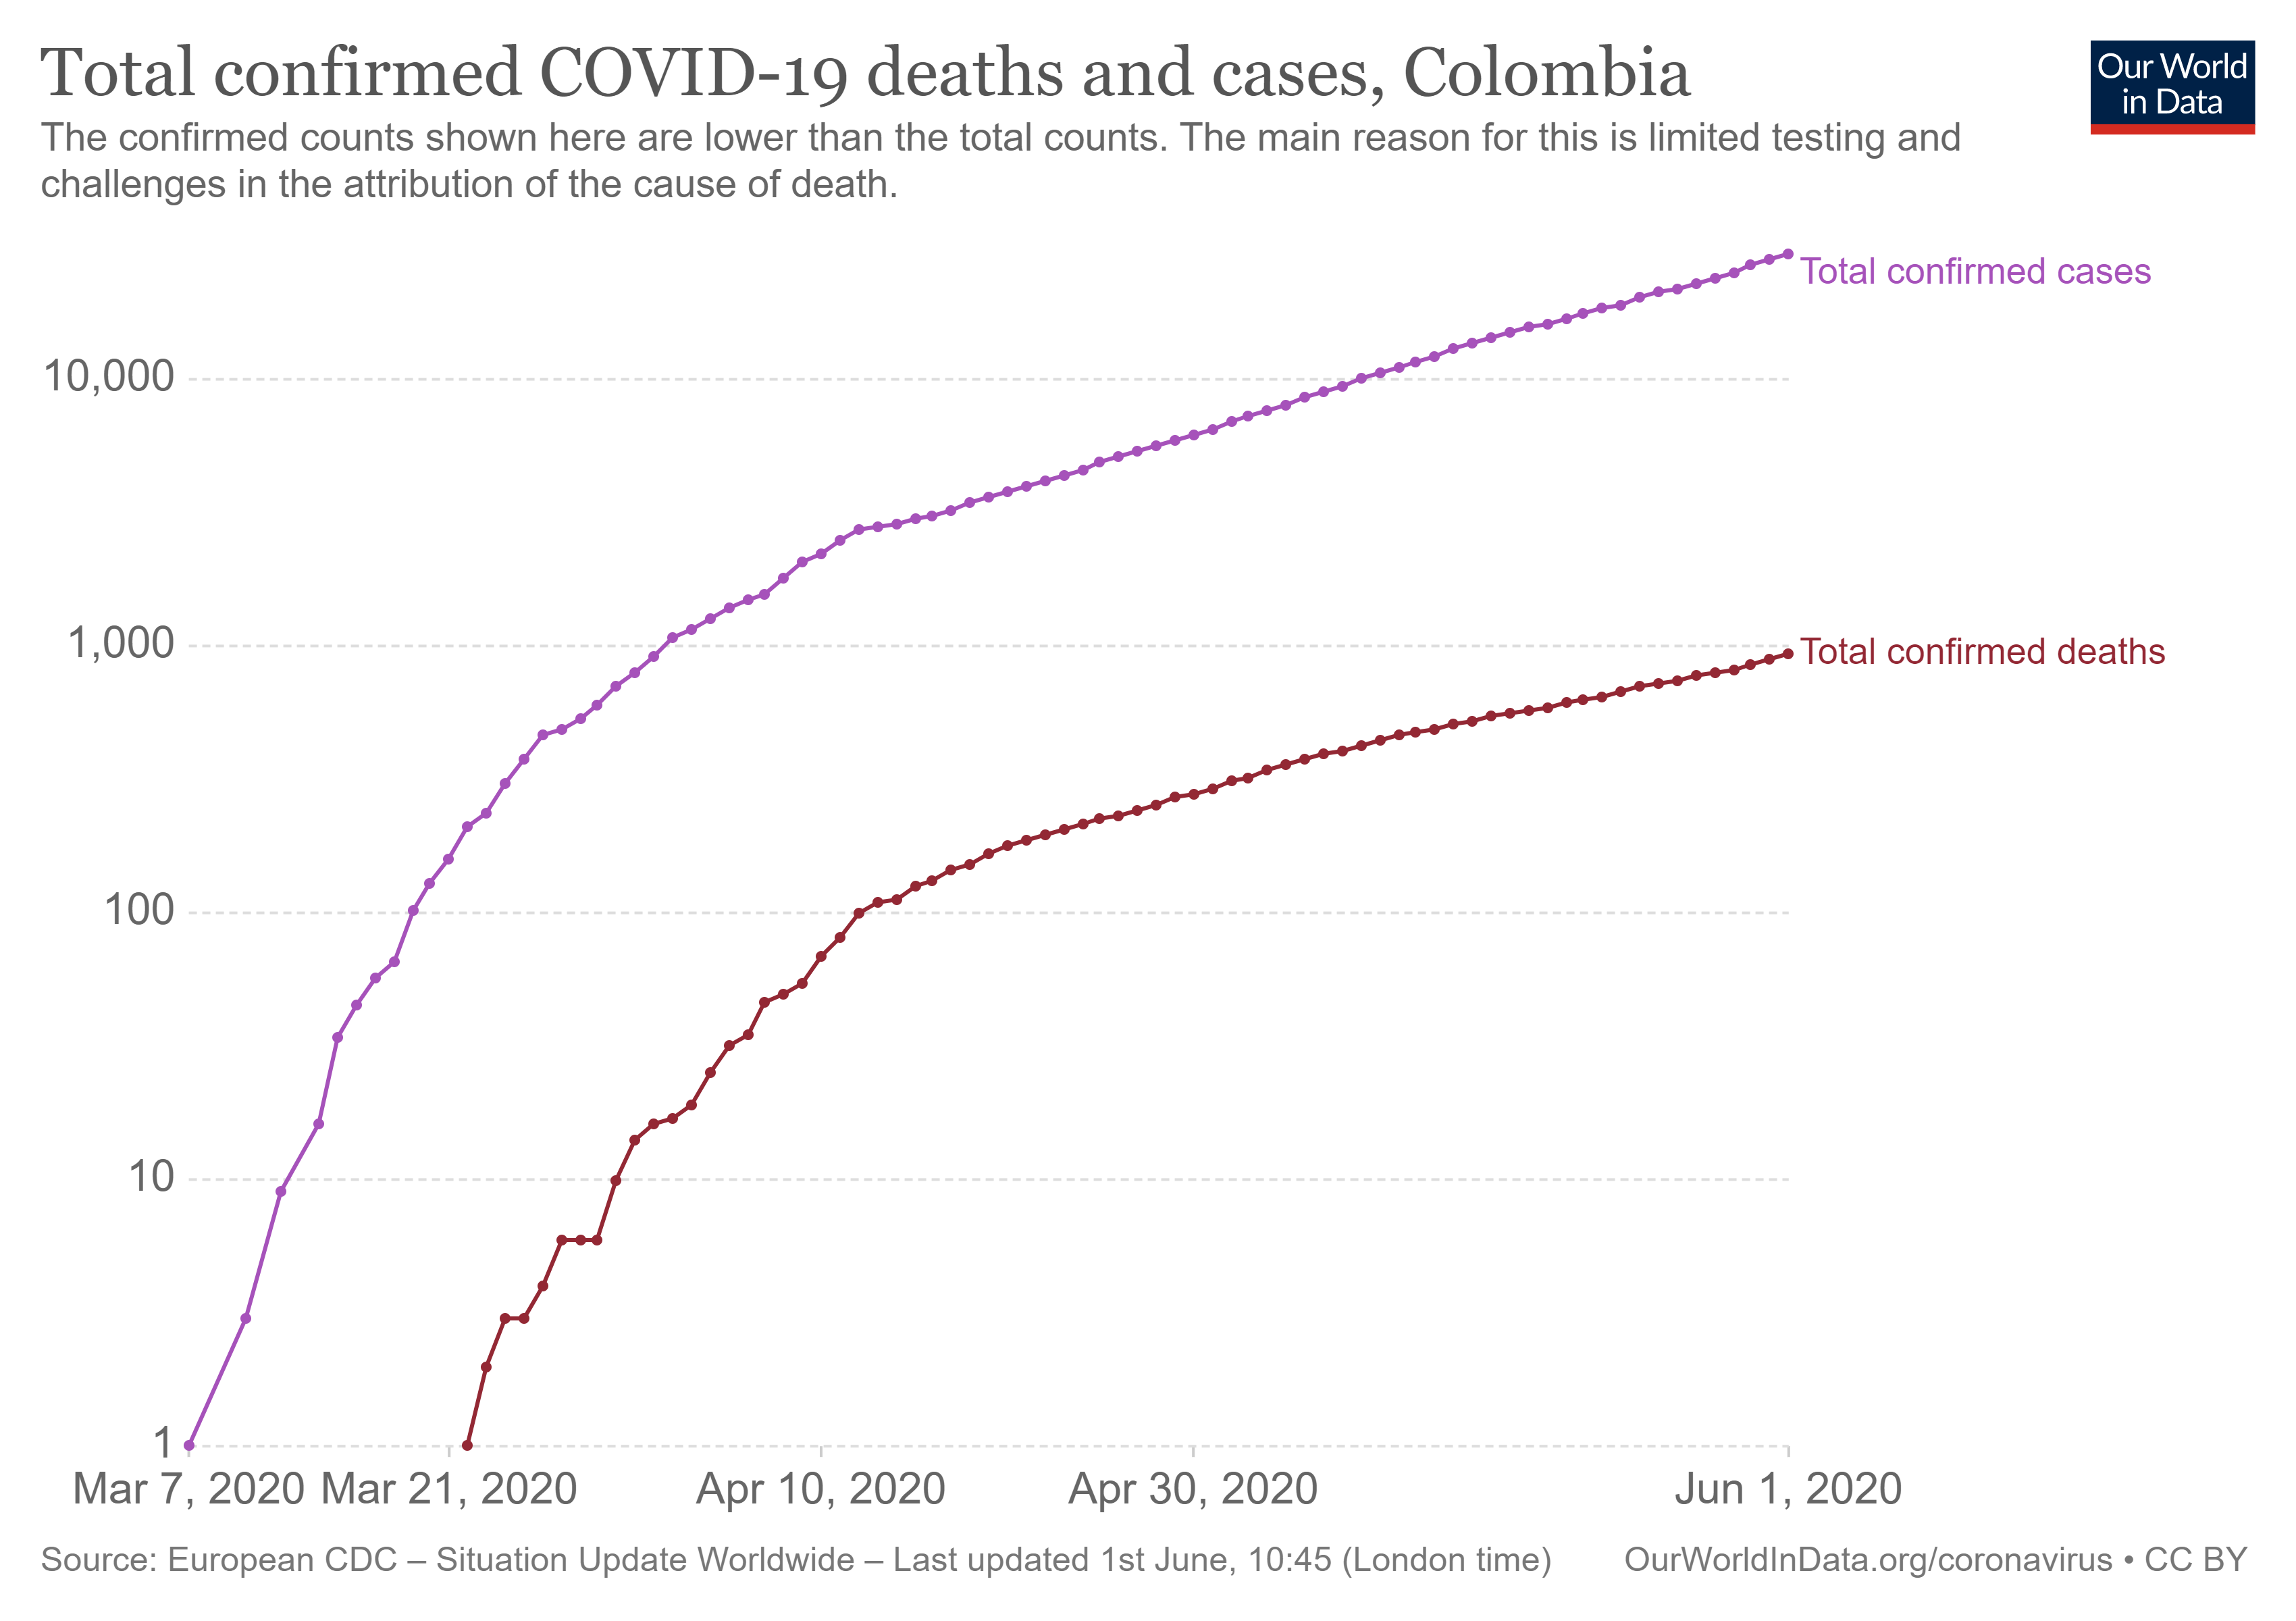
Figure 8: Colombia locked down, infections and deaths - curves also not yet flattened (log scale)
Colombia has also been trying to get testing done but not as successful as South Africa:
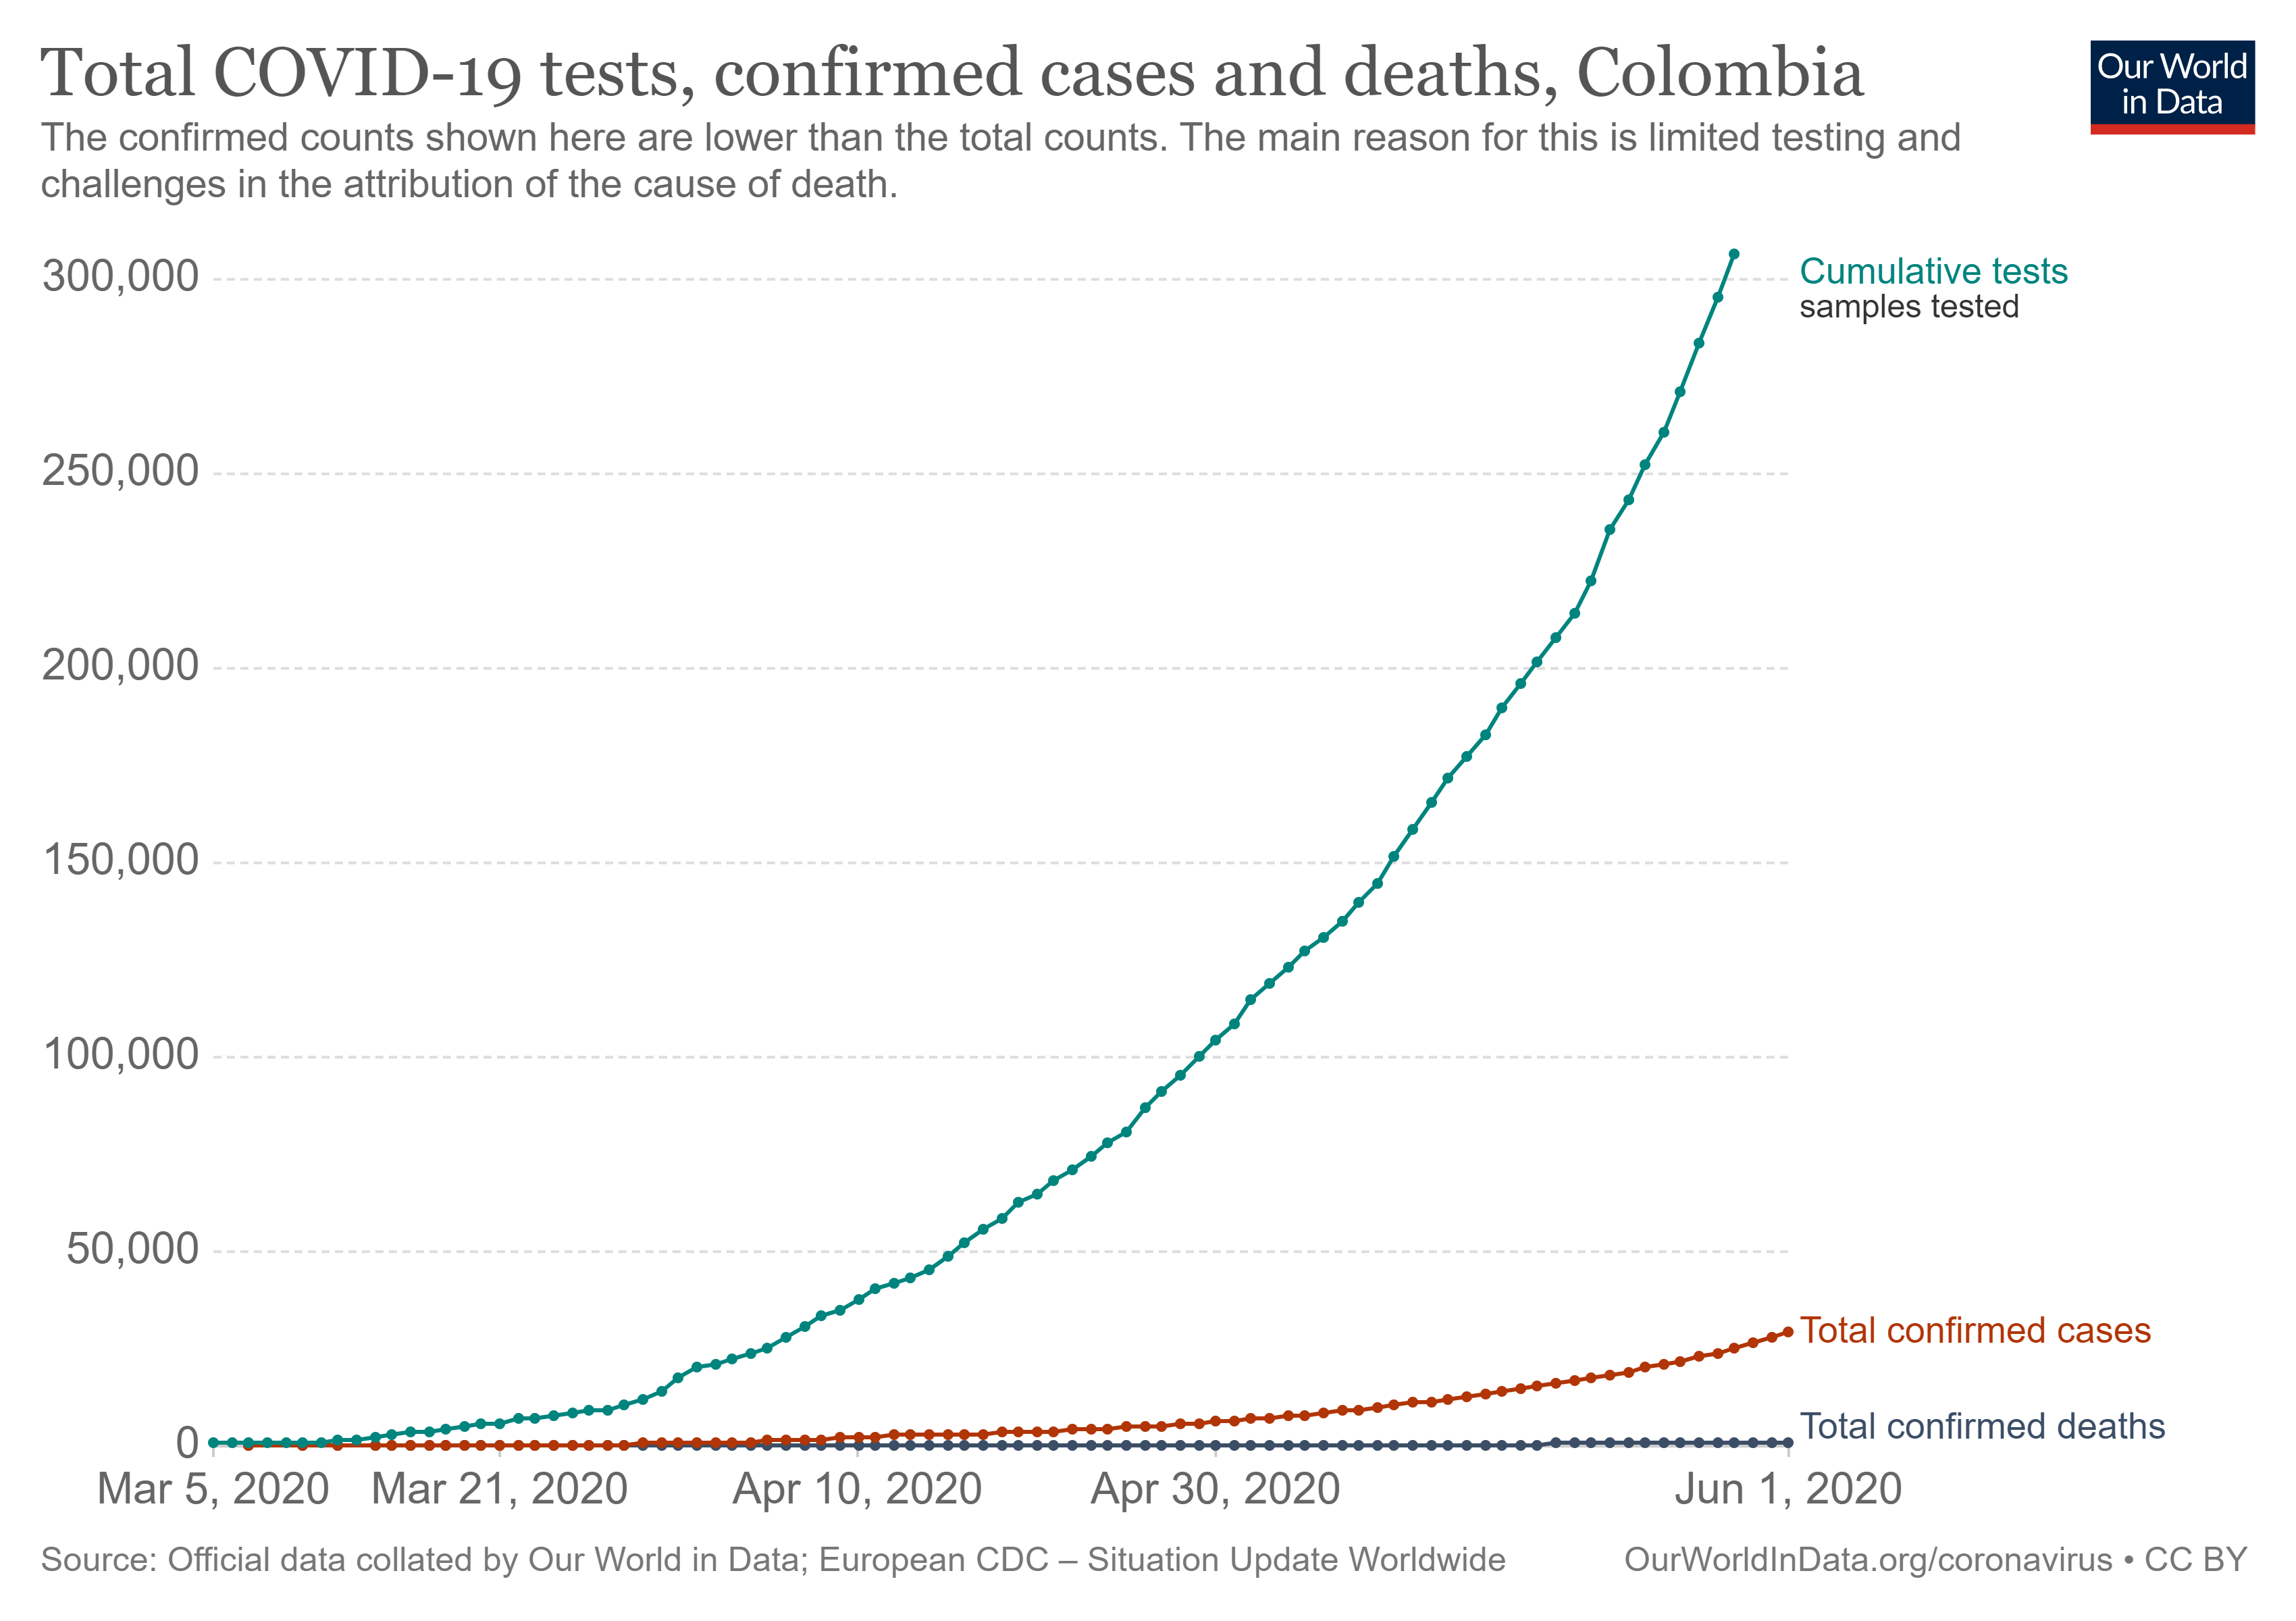
Figure 9: Colombia tests, cases and deaths (linear scale)
Confirmed cases at 31 May:
* Colombia 29,383
* South Africa 32,683
Confirmed deaths at 31 May:
* Colombia 939
* South Africa 683 (~30% less than Colombia)
South Africa completed more than double the number of tests completed in Colombia.
The total number of people infected are similar BUT South Africa have experienced 30% LESS deaths than Colombia (as recorded on 31 May 2020)
Compare to Nordic Countries
The countries who are neighbours to Sweden (Nordic countries) did implement lockdown and so a local alternative from the same cultural background as Sweden may be valuable to determine what a lockdown may look like from that region.
All these countries also have a much smaller population than South Africa (1/10th ) and therefore results are multiplied accordingly for the larger South African population.
Adjusted confirmed deaths equivalent (adjusted for equivalent population) – deaths counted up to 57 days after the first 5 deaths were recorded:
* Norway equivalent South African deaths: 2,300
* Denmark equivalent South African deaths: 4,900
* Actual South African deaths: 524
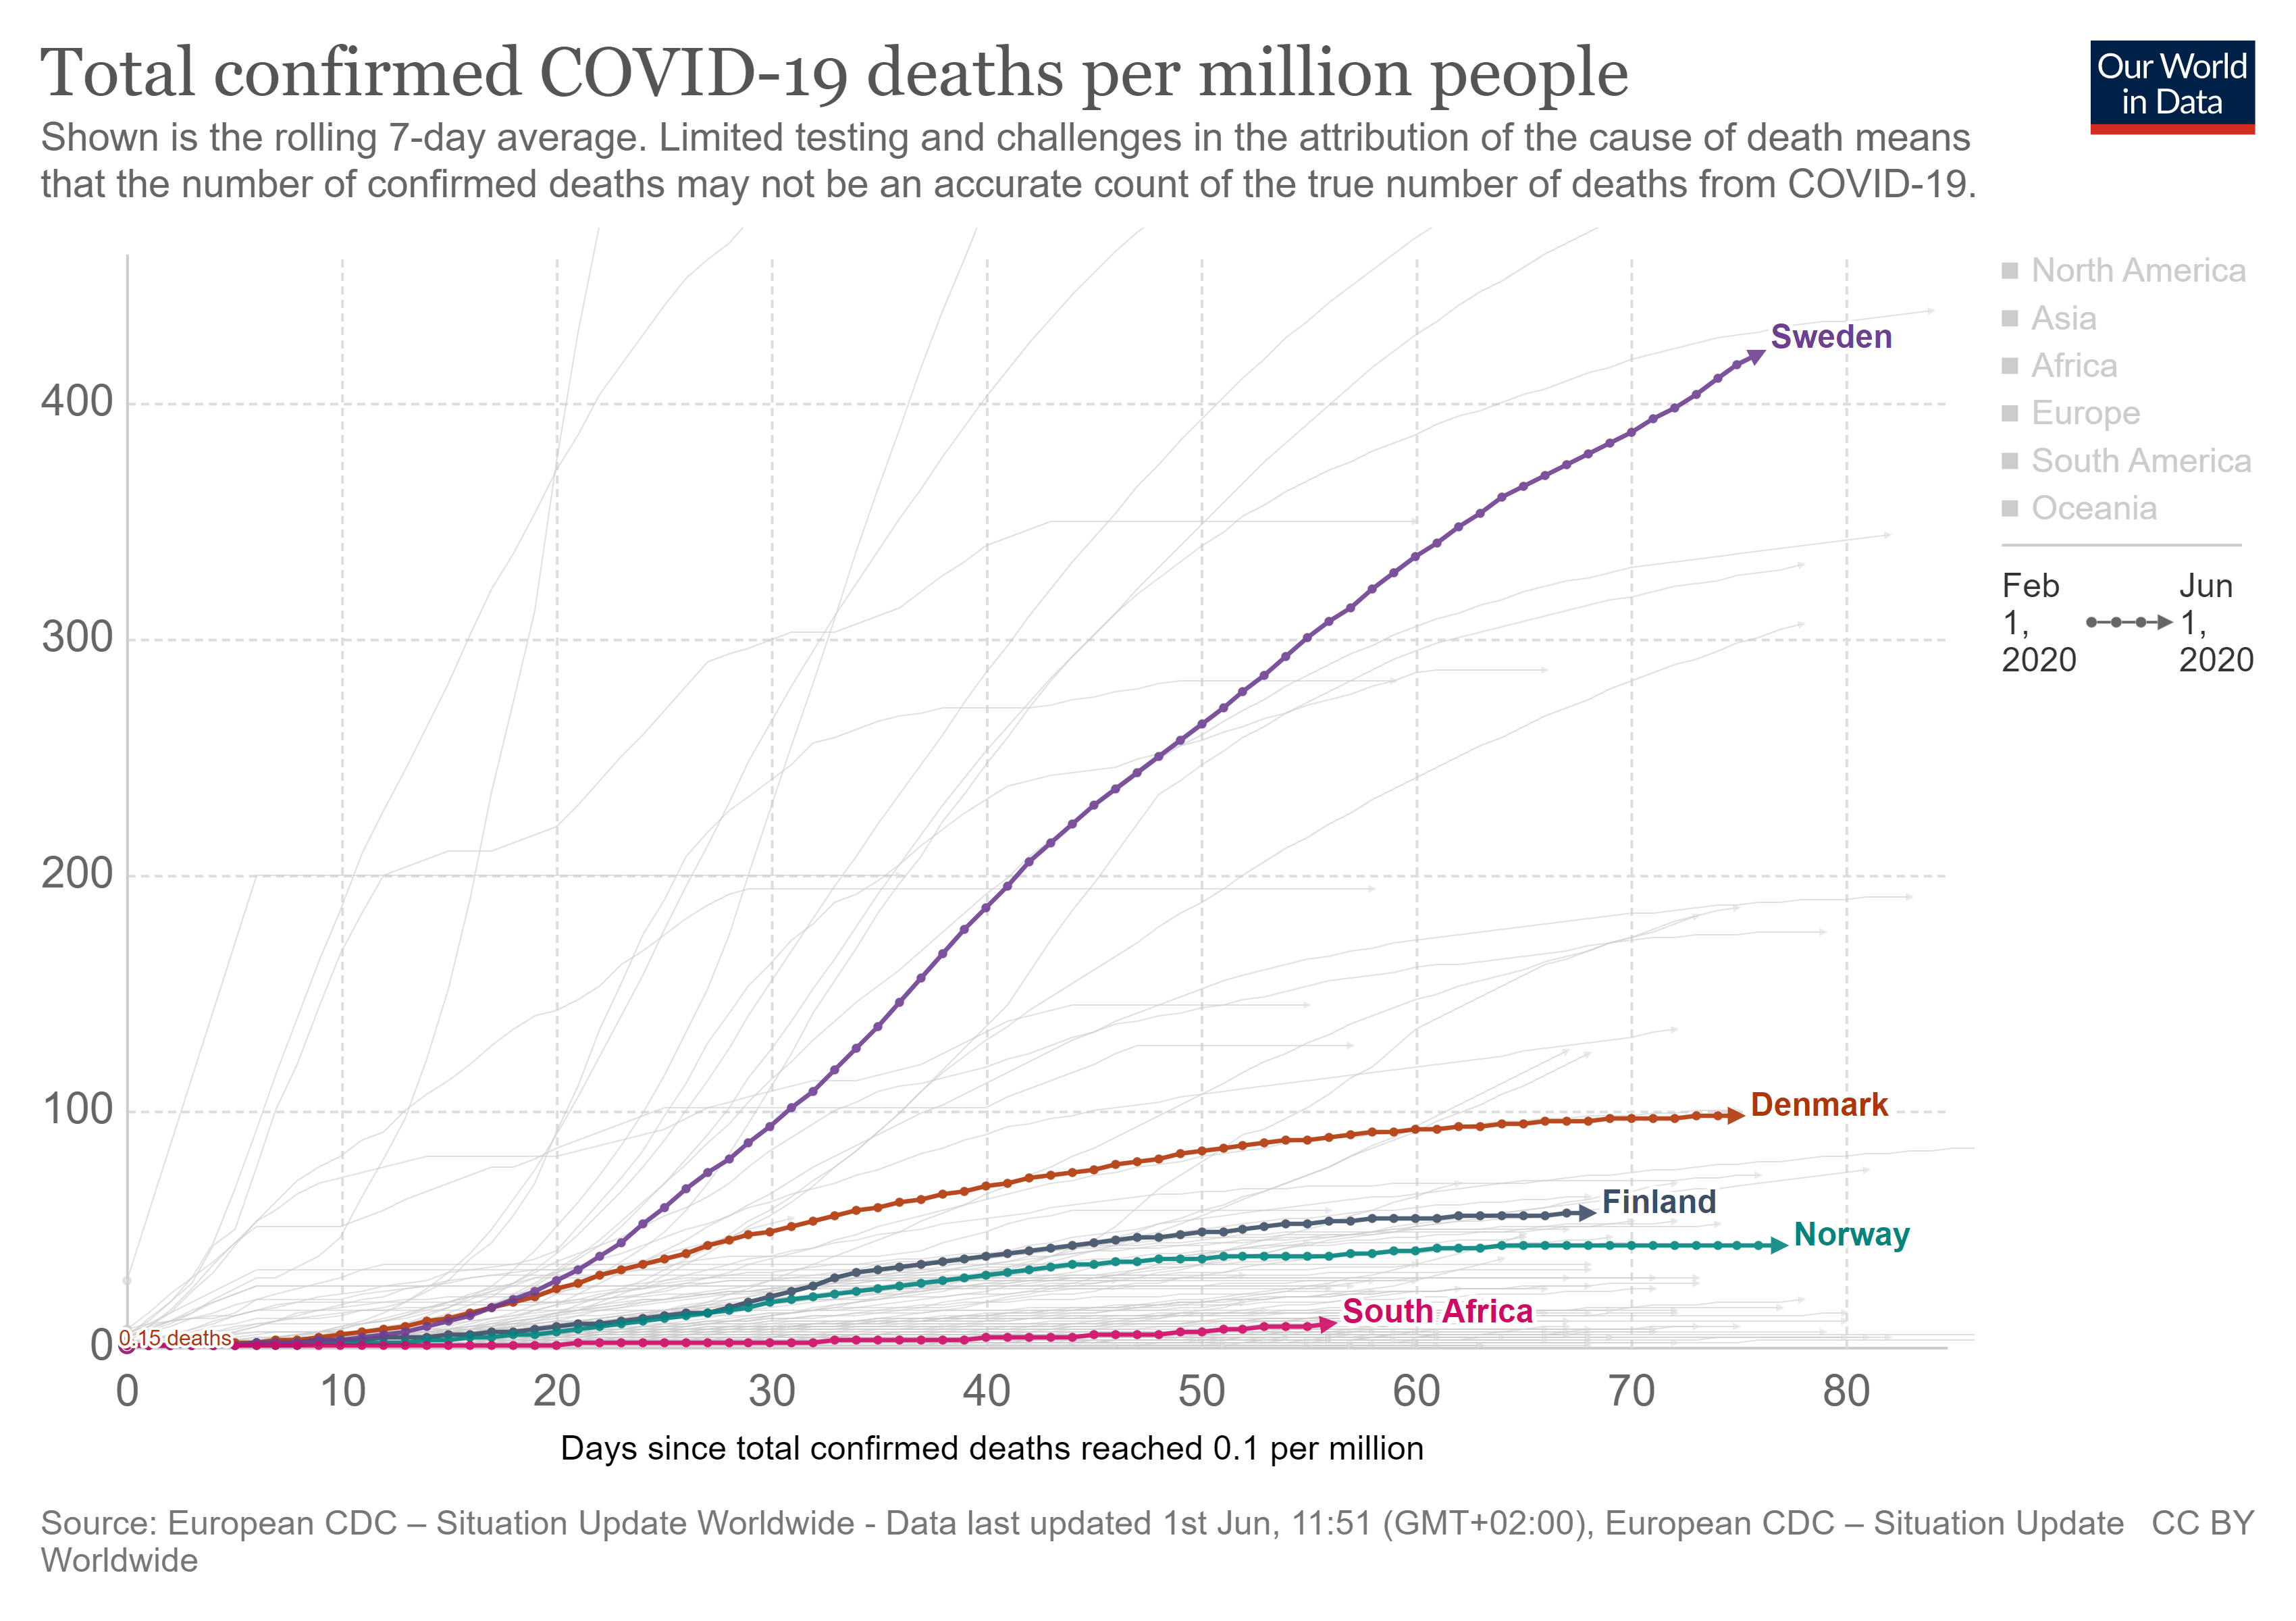
Figure 10: RSA deaths compared to Nordic Countries (Linear scale) per million people
In figure 10, the death toll is shown as a portion per 1 million people of total population on a linear scale. Therefore these countries can be directly compared with this data.
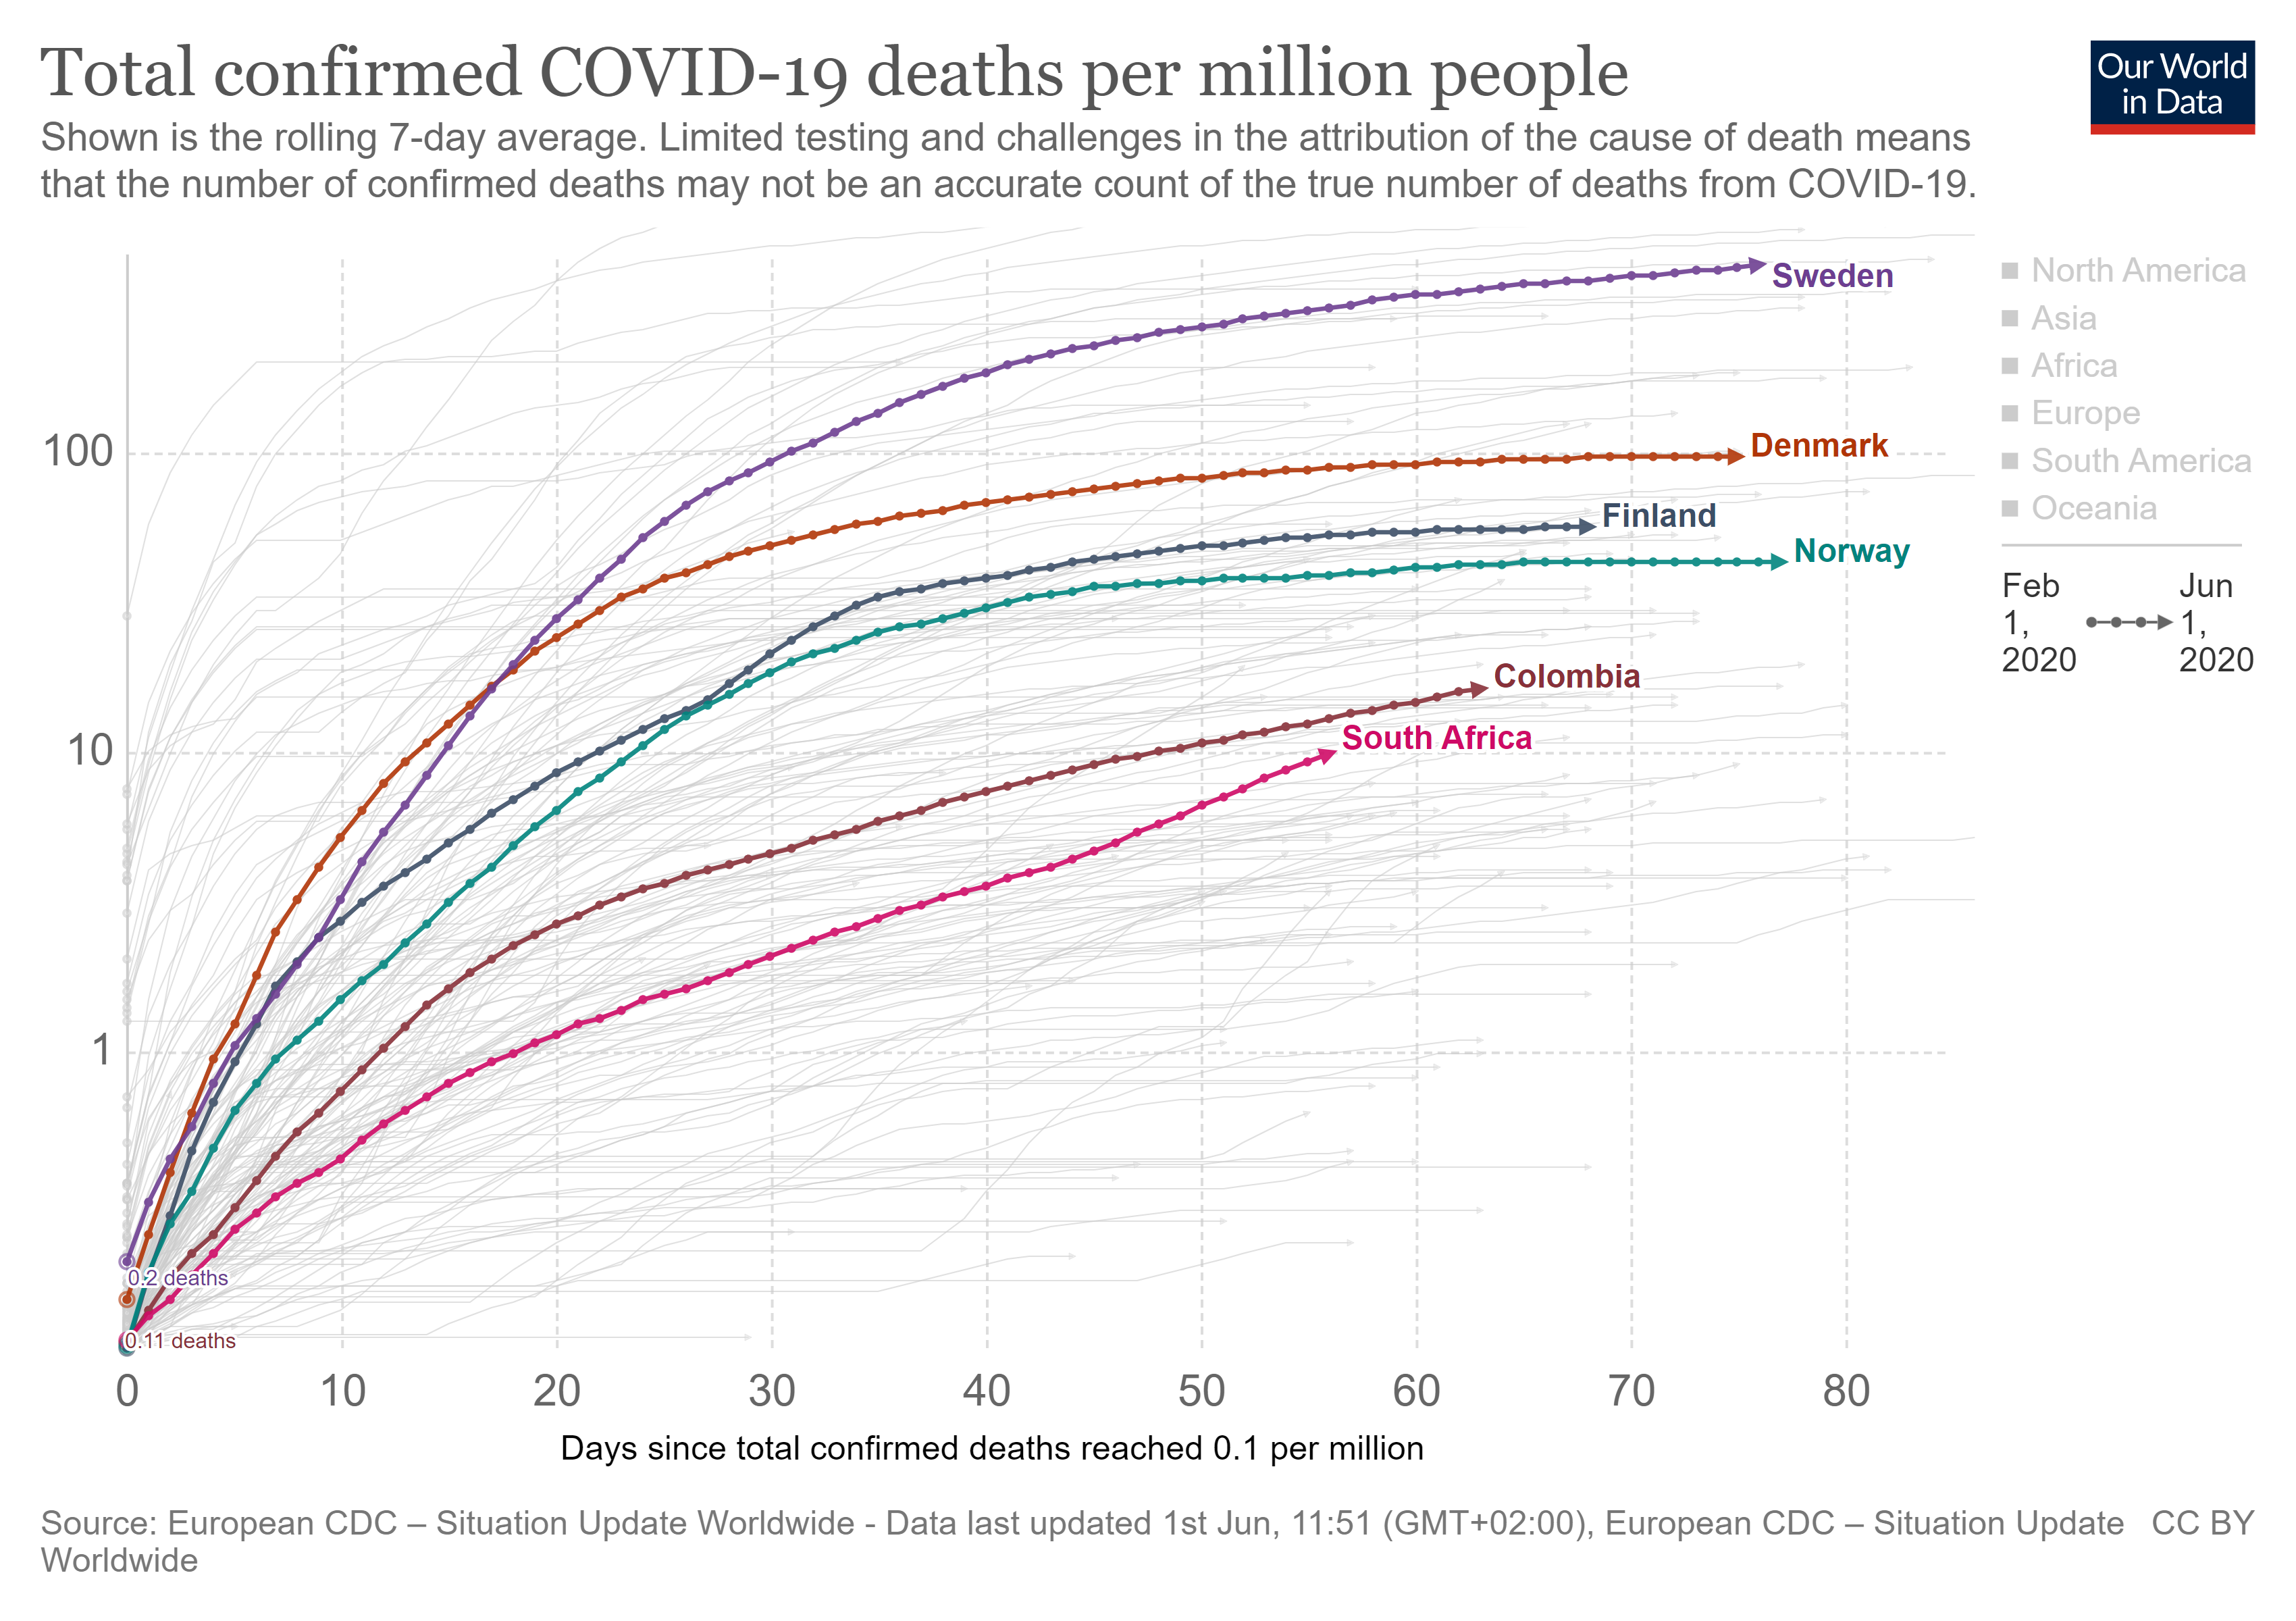
Figure 11: RSA compared to Nordic countries and Colombia (Log scale)
On an exponential graph, the lower death tolls of Colombia and South Africa are very good news.
Even comparing with countries who have implemented lockdown, the measures South Africa have applied have saved over 1,500 lives more than those countries.
South Africa have therefore managed to curtail the Covid-19 under lockdown and the answer to the question is YES.
THE NEXT STEPS …. LEVEL 3 AND BEYOND
The next steps ….. The distinct difference between South Africa and the countries who have battled the active virus in infected people for longer, is the shape of the curve.
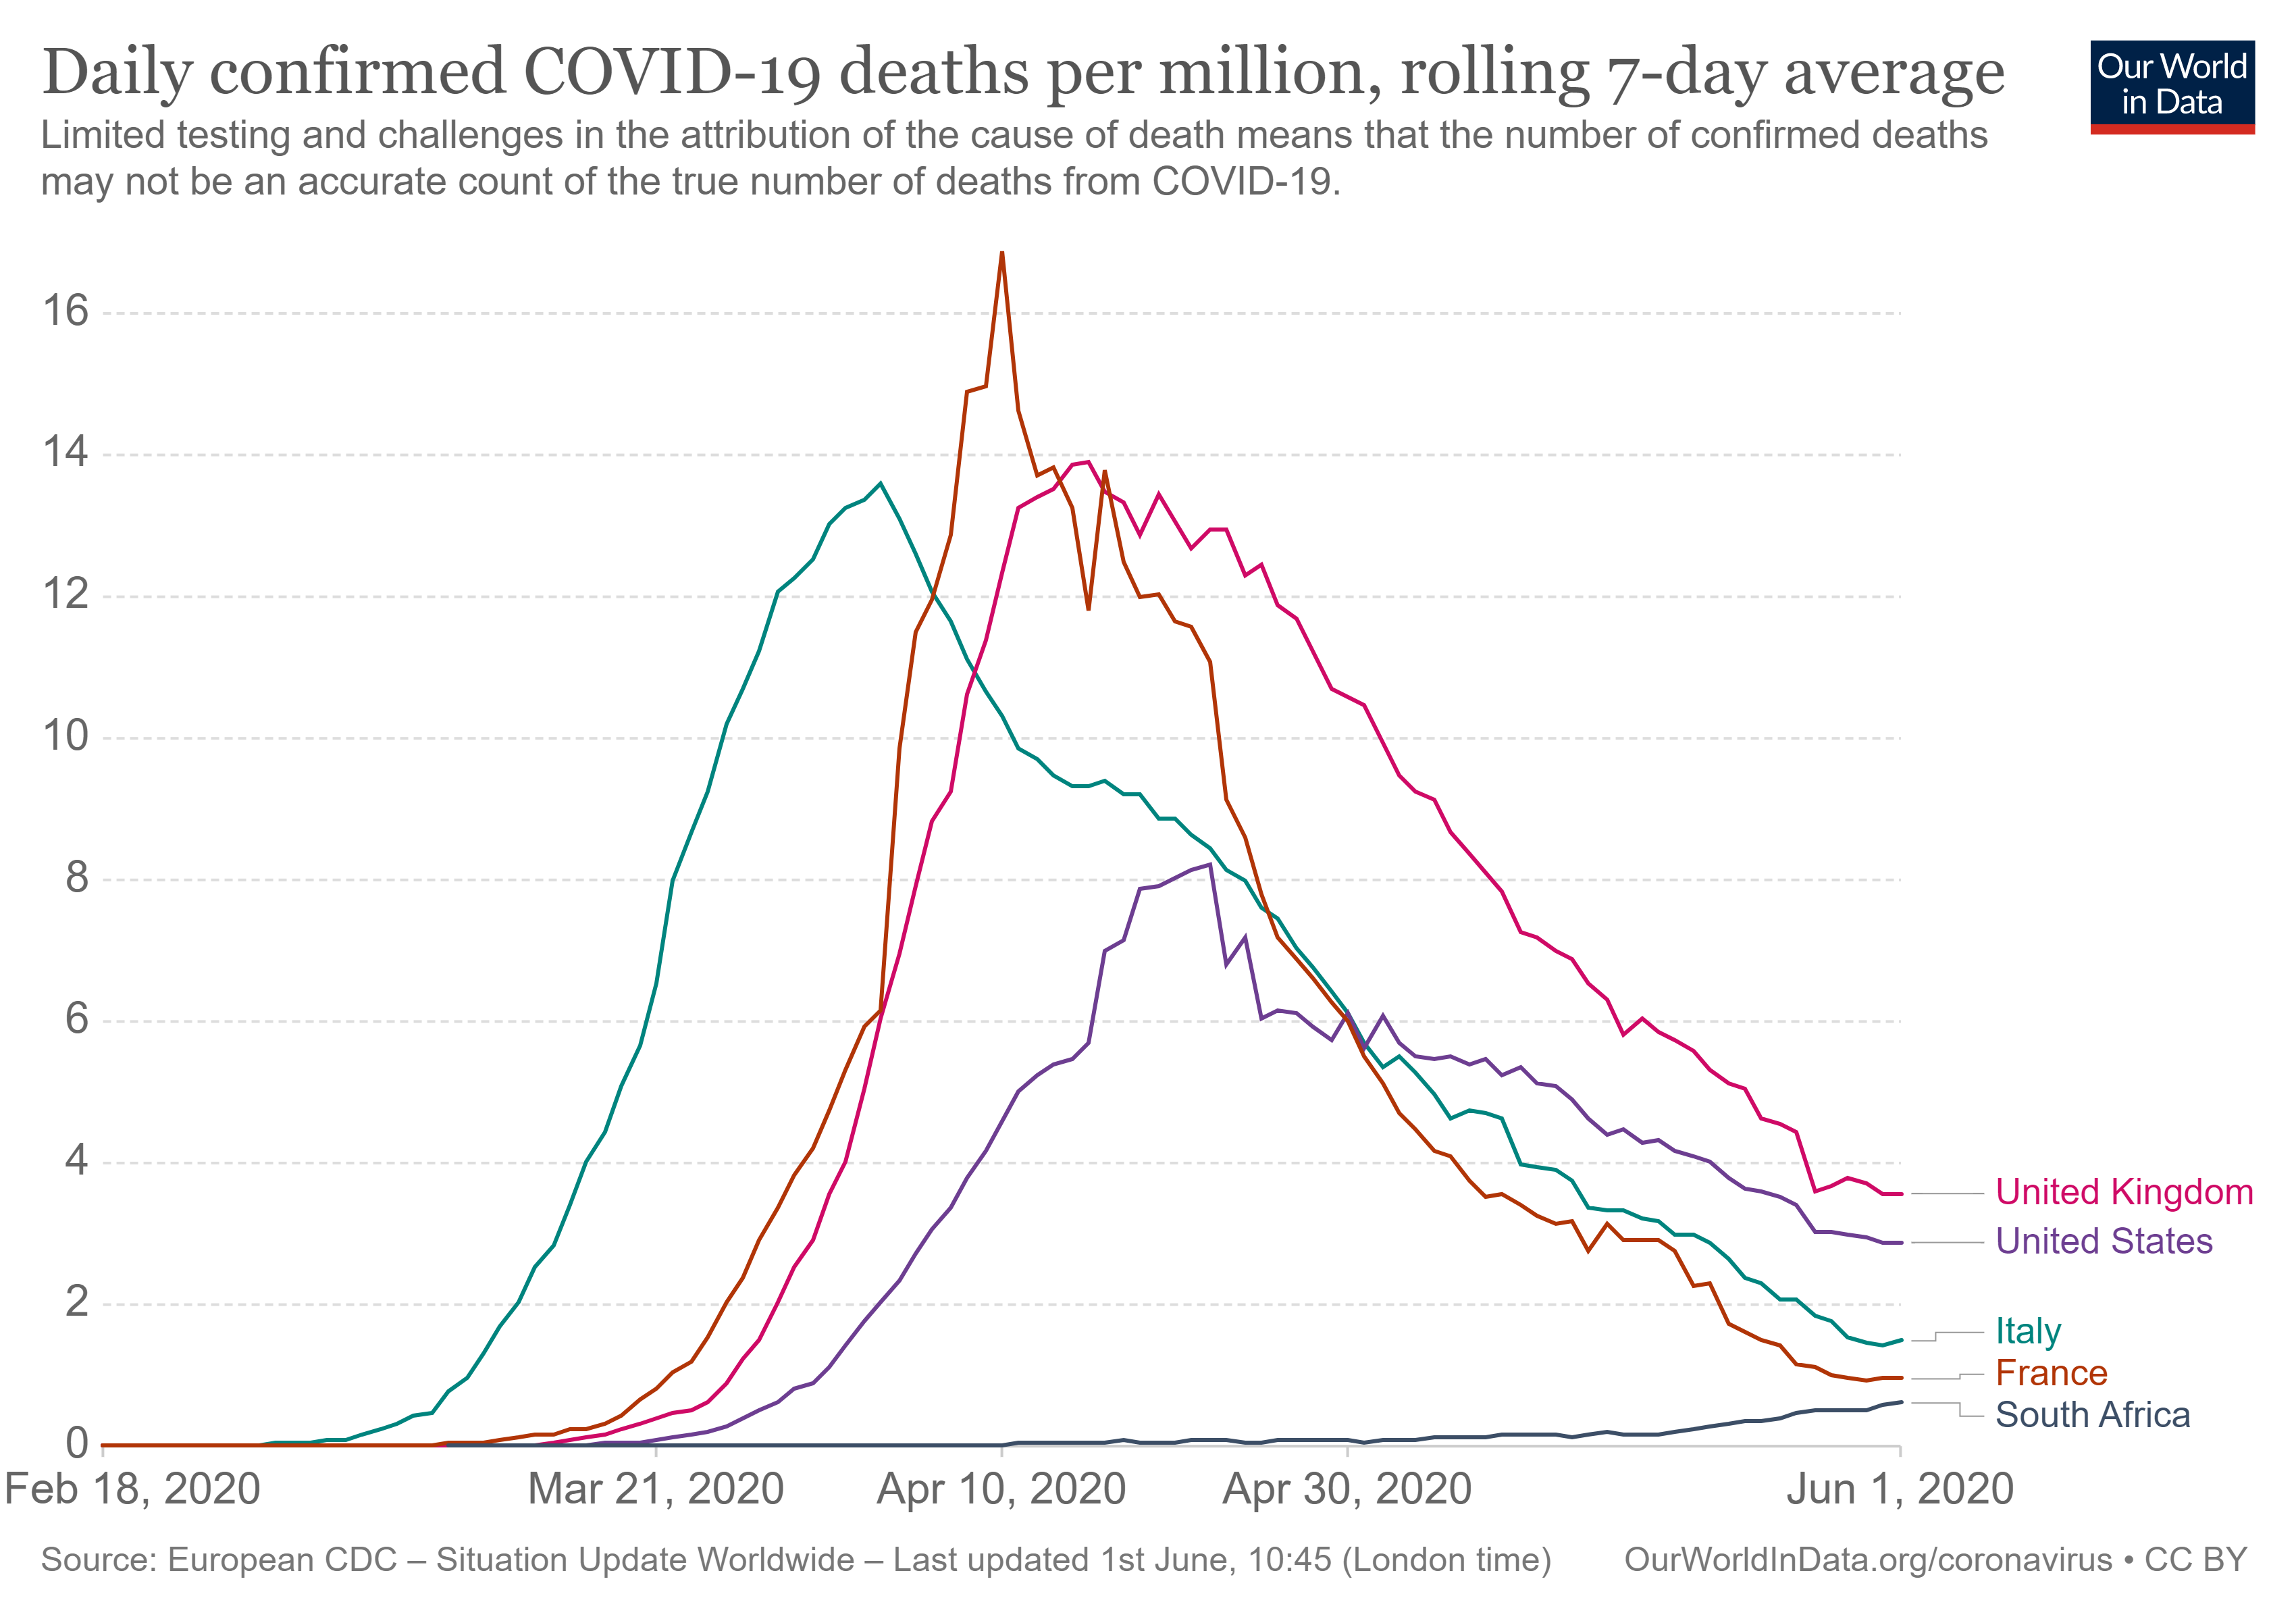
Figure 12: UK, USA, Italy, France vs RSA daily death toll (per million population)
Combining the data in figure 1 (worst hit countries), with the data in figures 6 and 11, the death toll in South Africa is still increasing on a daily basis with the death toll exceeding 30 over 5 of the last 7 days.
South Africa have yet to reach the peak.
PRE-LOCKDOWN RESURGENCE?
The Health Care leadership in South Africa expect that the infections will increase at a faster rate as lockdown measures are relaxed.
Expect to see some change in daily infections approximately 14 days after the lockdown level changes – for level 3 a change in rates could be visible from 12th June onwards.
PURPOSE OF THE LOCKDOWN?
The declared purpose of the lockdown in South Africa was to empower the health care industry to be able to build capacity to care for all Covid-19 critical cases – set up enough beds and equipment as well as supply adequate personal protective equipment to protect health care workers.
COVID-19 CRITICAL CARE
A small percentage of infected people will require hospital care. The exact numbers are not known since every country has acted differently with different circumstances. In some countries the percentage can be as high as 12% while in others it is as low as 2%. The CONFIRMED number of infected people at any time is dependent on how effectively testing has been possible.
What is clear is that the number of people requiring medical attention will increase as more people become infected. The faster the rate of infection, the more people will require medical attention.
MEDICAL CARE INDUSTRY PREPARATION
During the past 9 weeks (27 March to 1 June) the South African medical care services in South Africa have been gearing up for that increase in demand.
Not only must the hospitals be able to serve Covid-19 patients, but they must also continue providing health care for all other patients.
Critical care has been ongoing for TB, HIV/Aids and cancer to name but a few other critical health care requirements.
If there are no beds or suitable medical equipment available, these patients will die.
In addition, health care workers must themselves remain healthy and therefore must be appropriately protected.
Italy, France, the United Kingdom, Spain and the USA were among the countries who were not able to “buy time” before death struck..
ENDING SEVERE LOCKDOWN
Ending lockdown for the majority of the South African economy opens the door to a rapid increase in Covid-19 infections.
How fast will the infections increase?
FLATTENING THE SOUTH AFRICAN CURVE
Every man, woman and child in South Africa is required to help “flatten the curve”.
The lockdown in South Africa changed the rate of infection from 30 March 2020. Figure 13 shows the exponential increase in cases in South Africa up to 30 March 2020 – 4 days after level 5 lockdown was implemented. Rate of infection was equal to the worst hit countries shown in the graph.
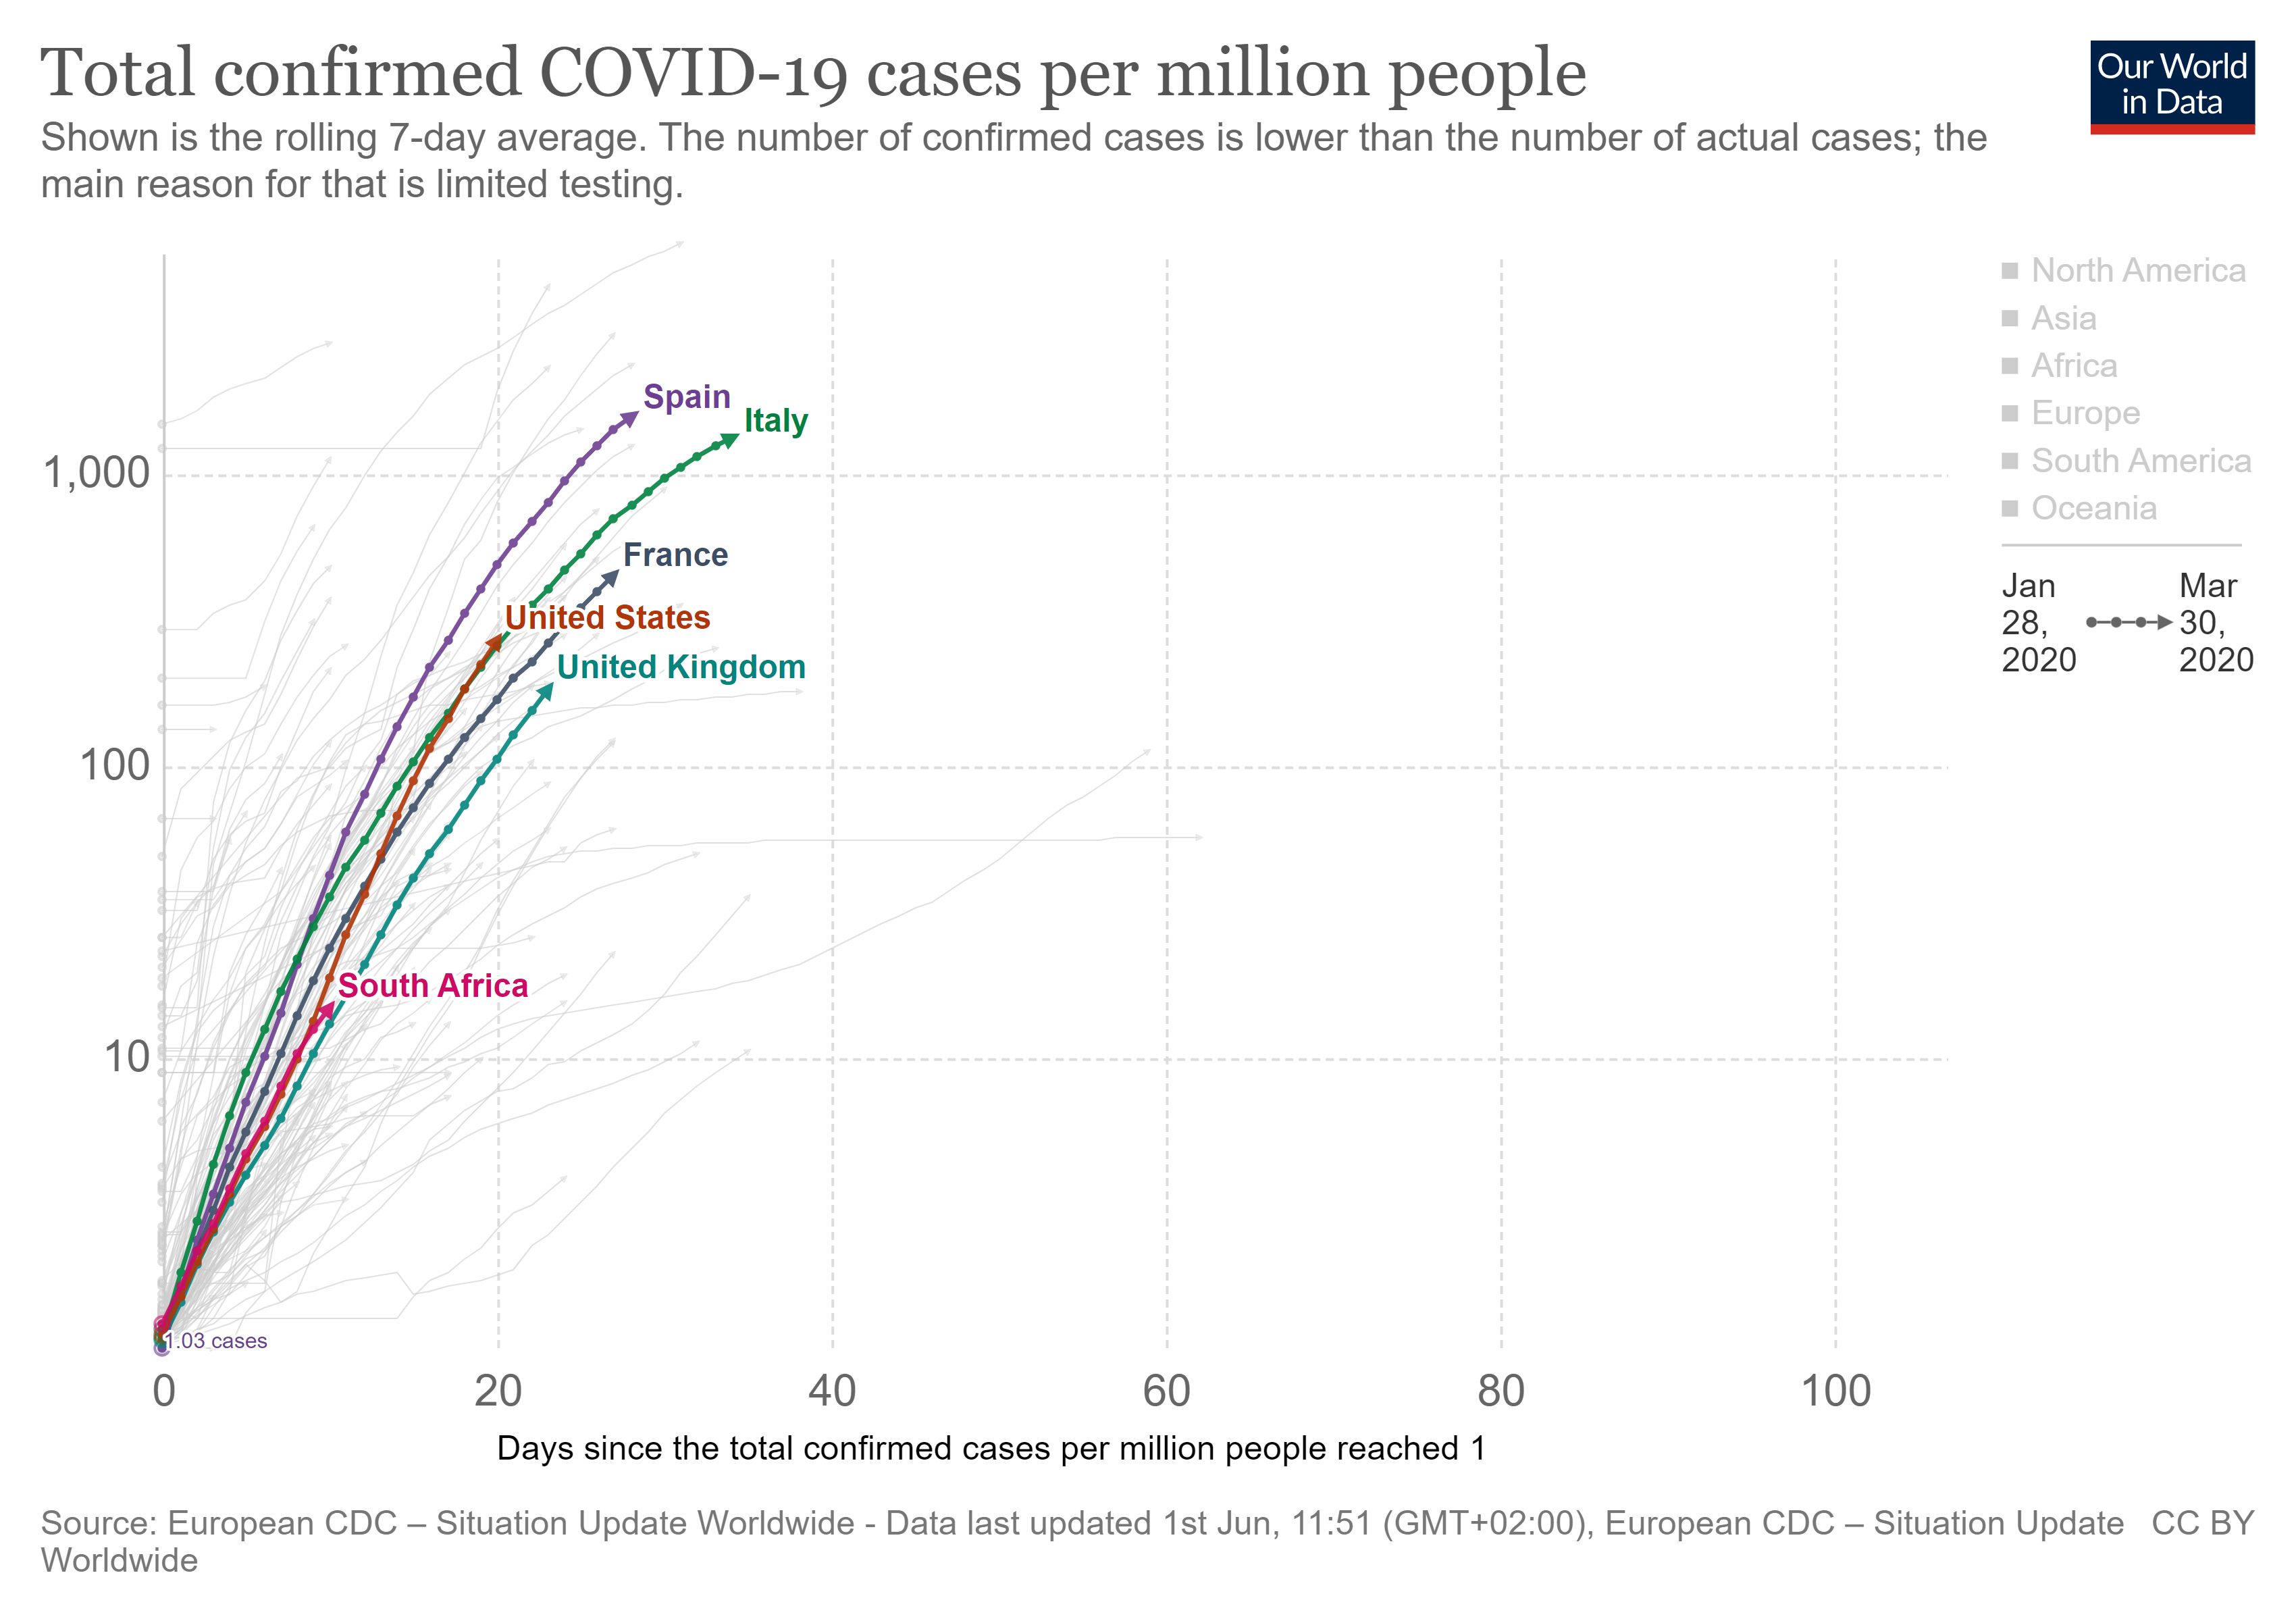
Figure 13: RSA rate of infection up to 30 March matching Italy, France, Spain, UK and USA (recorded from date 1 per million was detected)
Within 5 days (after 30 March) the rate of infection slowed down and started a new trajectory that is visible in the next figure. Lockdown was imposed on 27 March and the consequences were notable within 9 days (5 April).
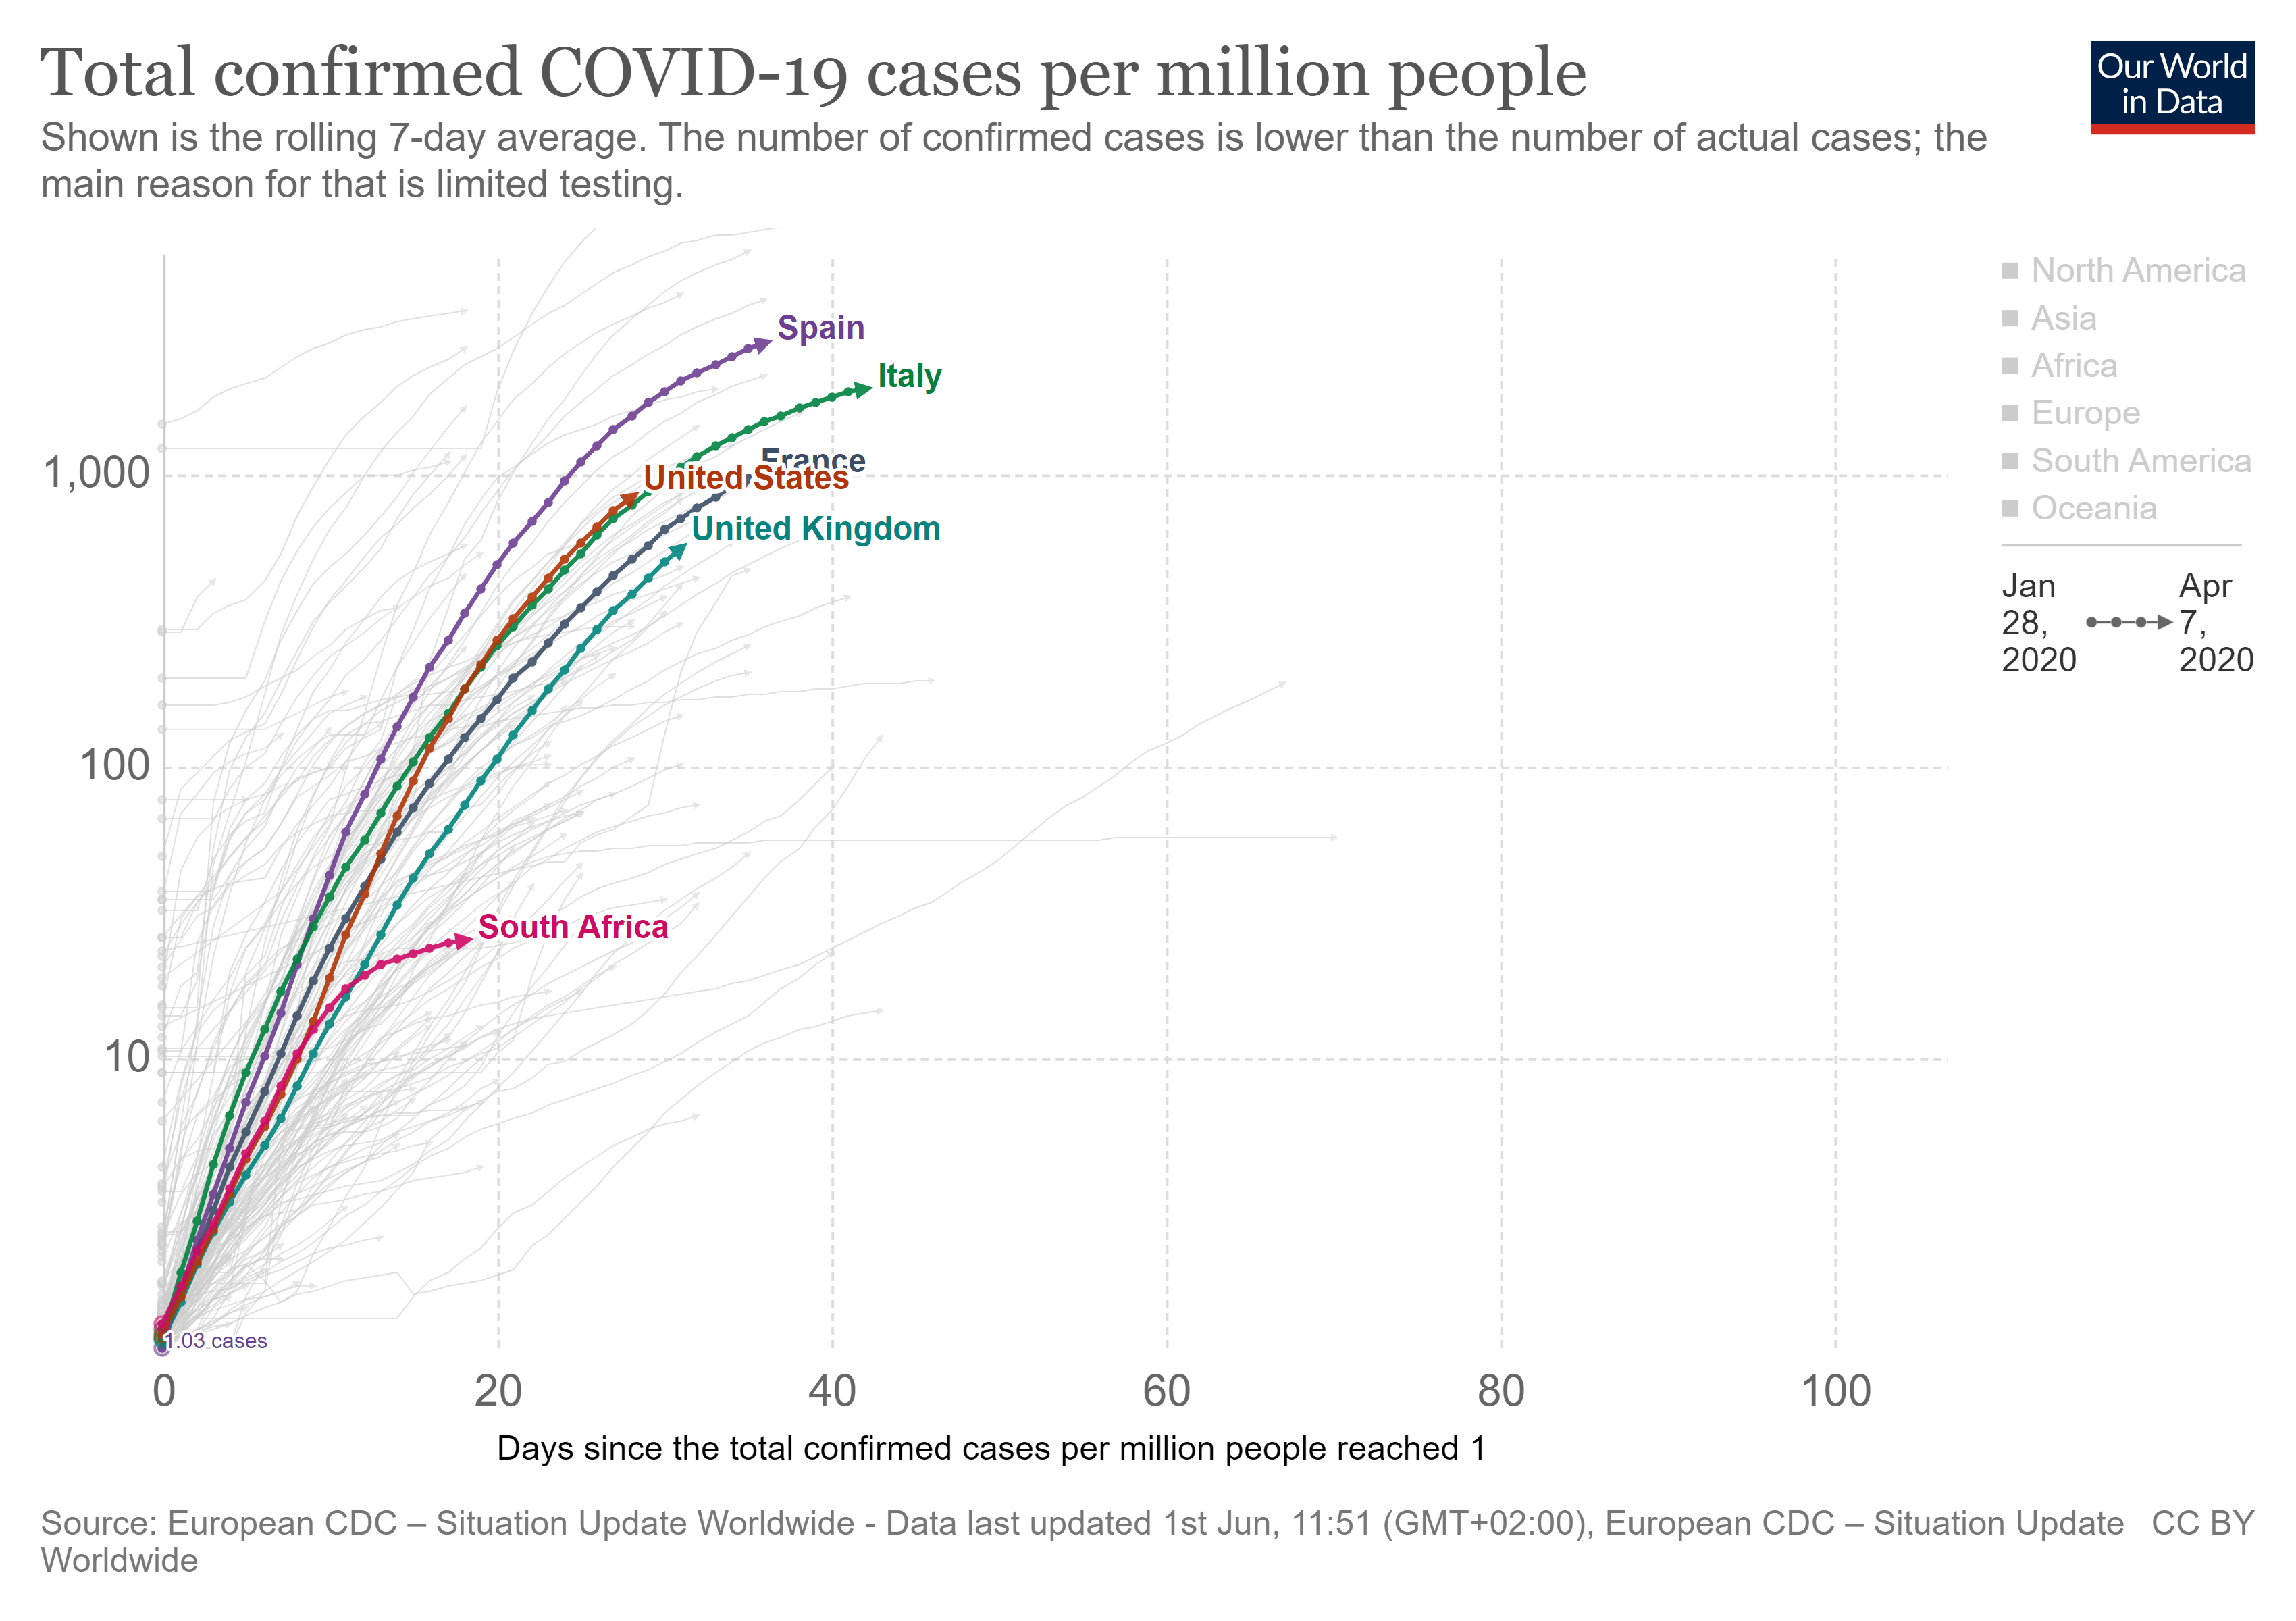
Figure 14: RSA rate of infection up to 5 April – infection rate reduced on new trajectory.
The lockdown was eased from level 5 to level 4 on 1 May, allowing essential services and public works projects to resume.
On 15 May (14 days after lockdown level change) a marginal step-change in infection was noticeable but no change in infection rate.
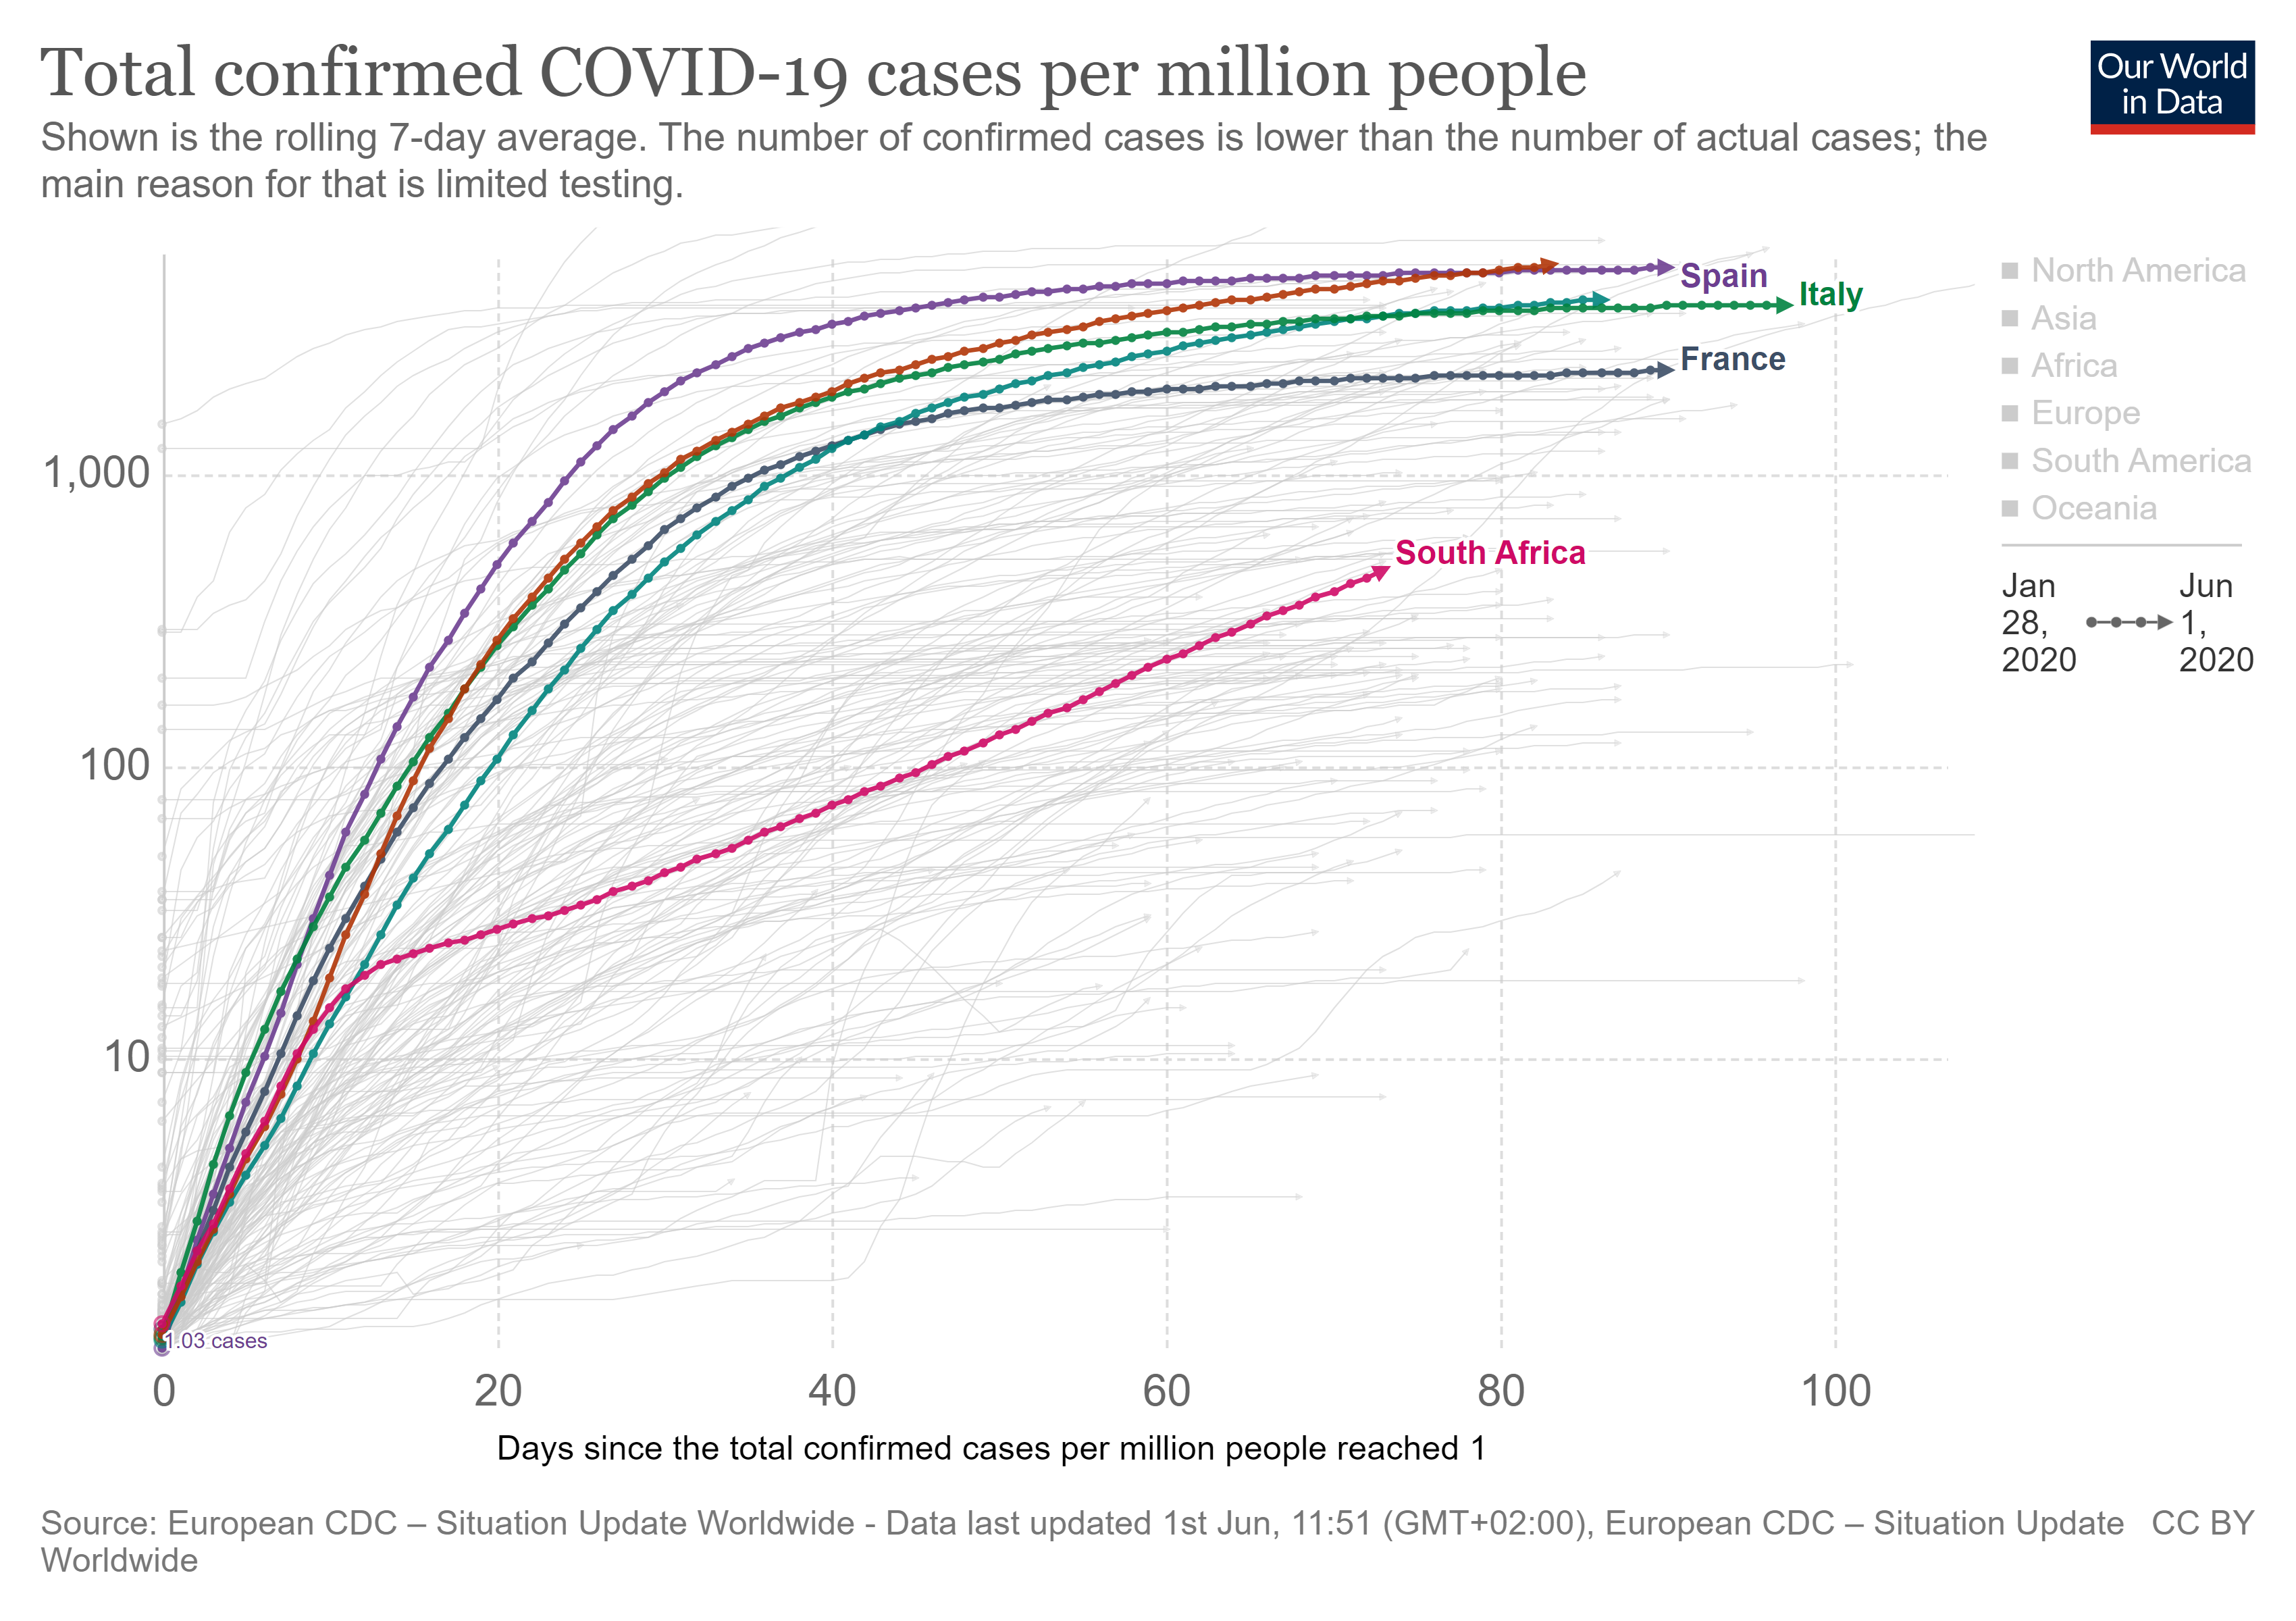
Figure 15: RSA rate of infection up to 1 June – infection rate constant on new trajectory.
The rate of infection in South Africa tracked daily, has remained on a constant trajectory since lockdown was implemented in March.
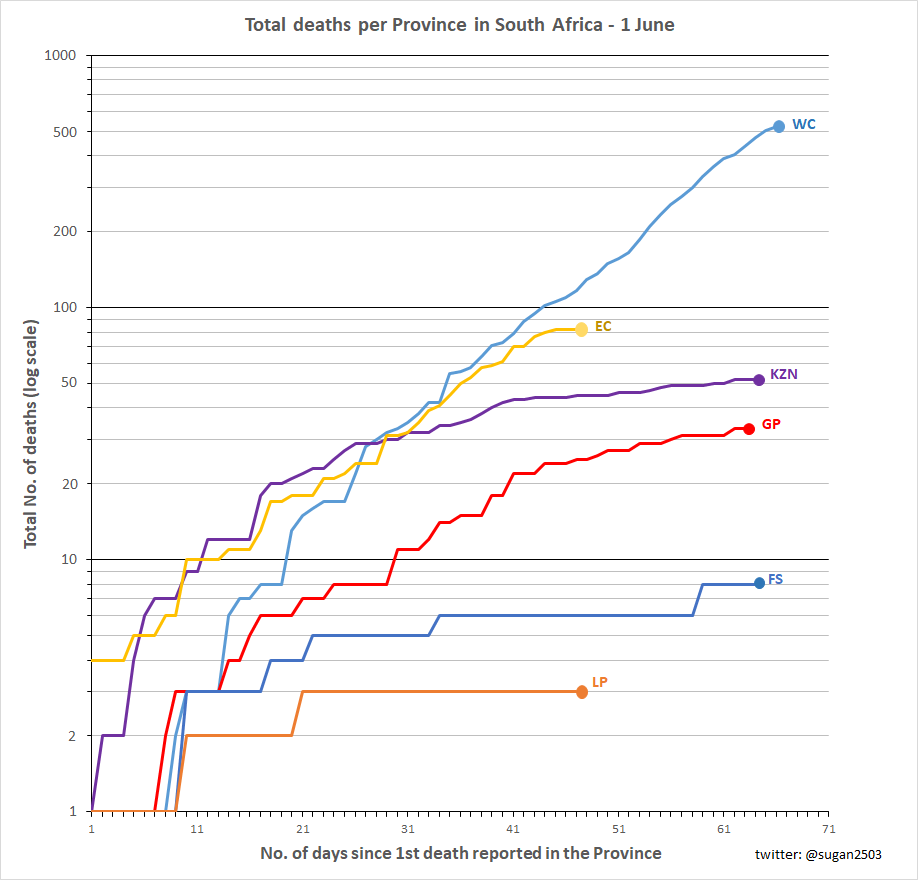
GLOBAL, COUNTRY, PROVINCE AND DISTRICT
Just as much as South Africa can be segregated from other countries, so we can track and report infections and deaths in the provinces and districts within South Africa in the same manner.
All of the analysis and interpretation is only possible by having adequate information by which to understand what the infection is doing and how our actions are helping.
It is important to recognise that South Africa has adopted the full WHO testing philosophy including identifying asymptomatic cases. That is, South Africa have undertaken not only to respond to people who have visible symptoms but to also seek out people who do not know that they have been infected.
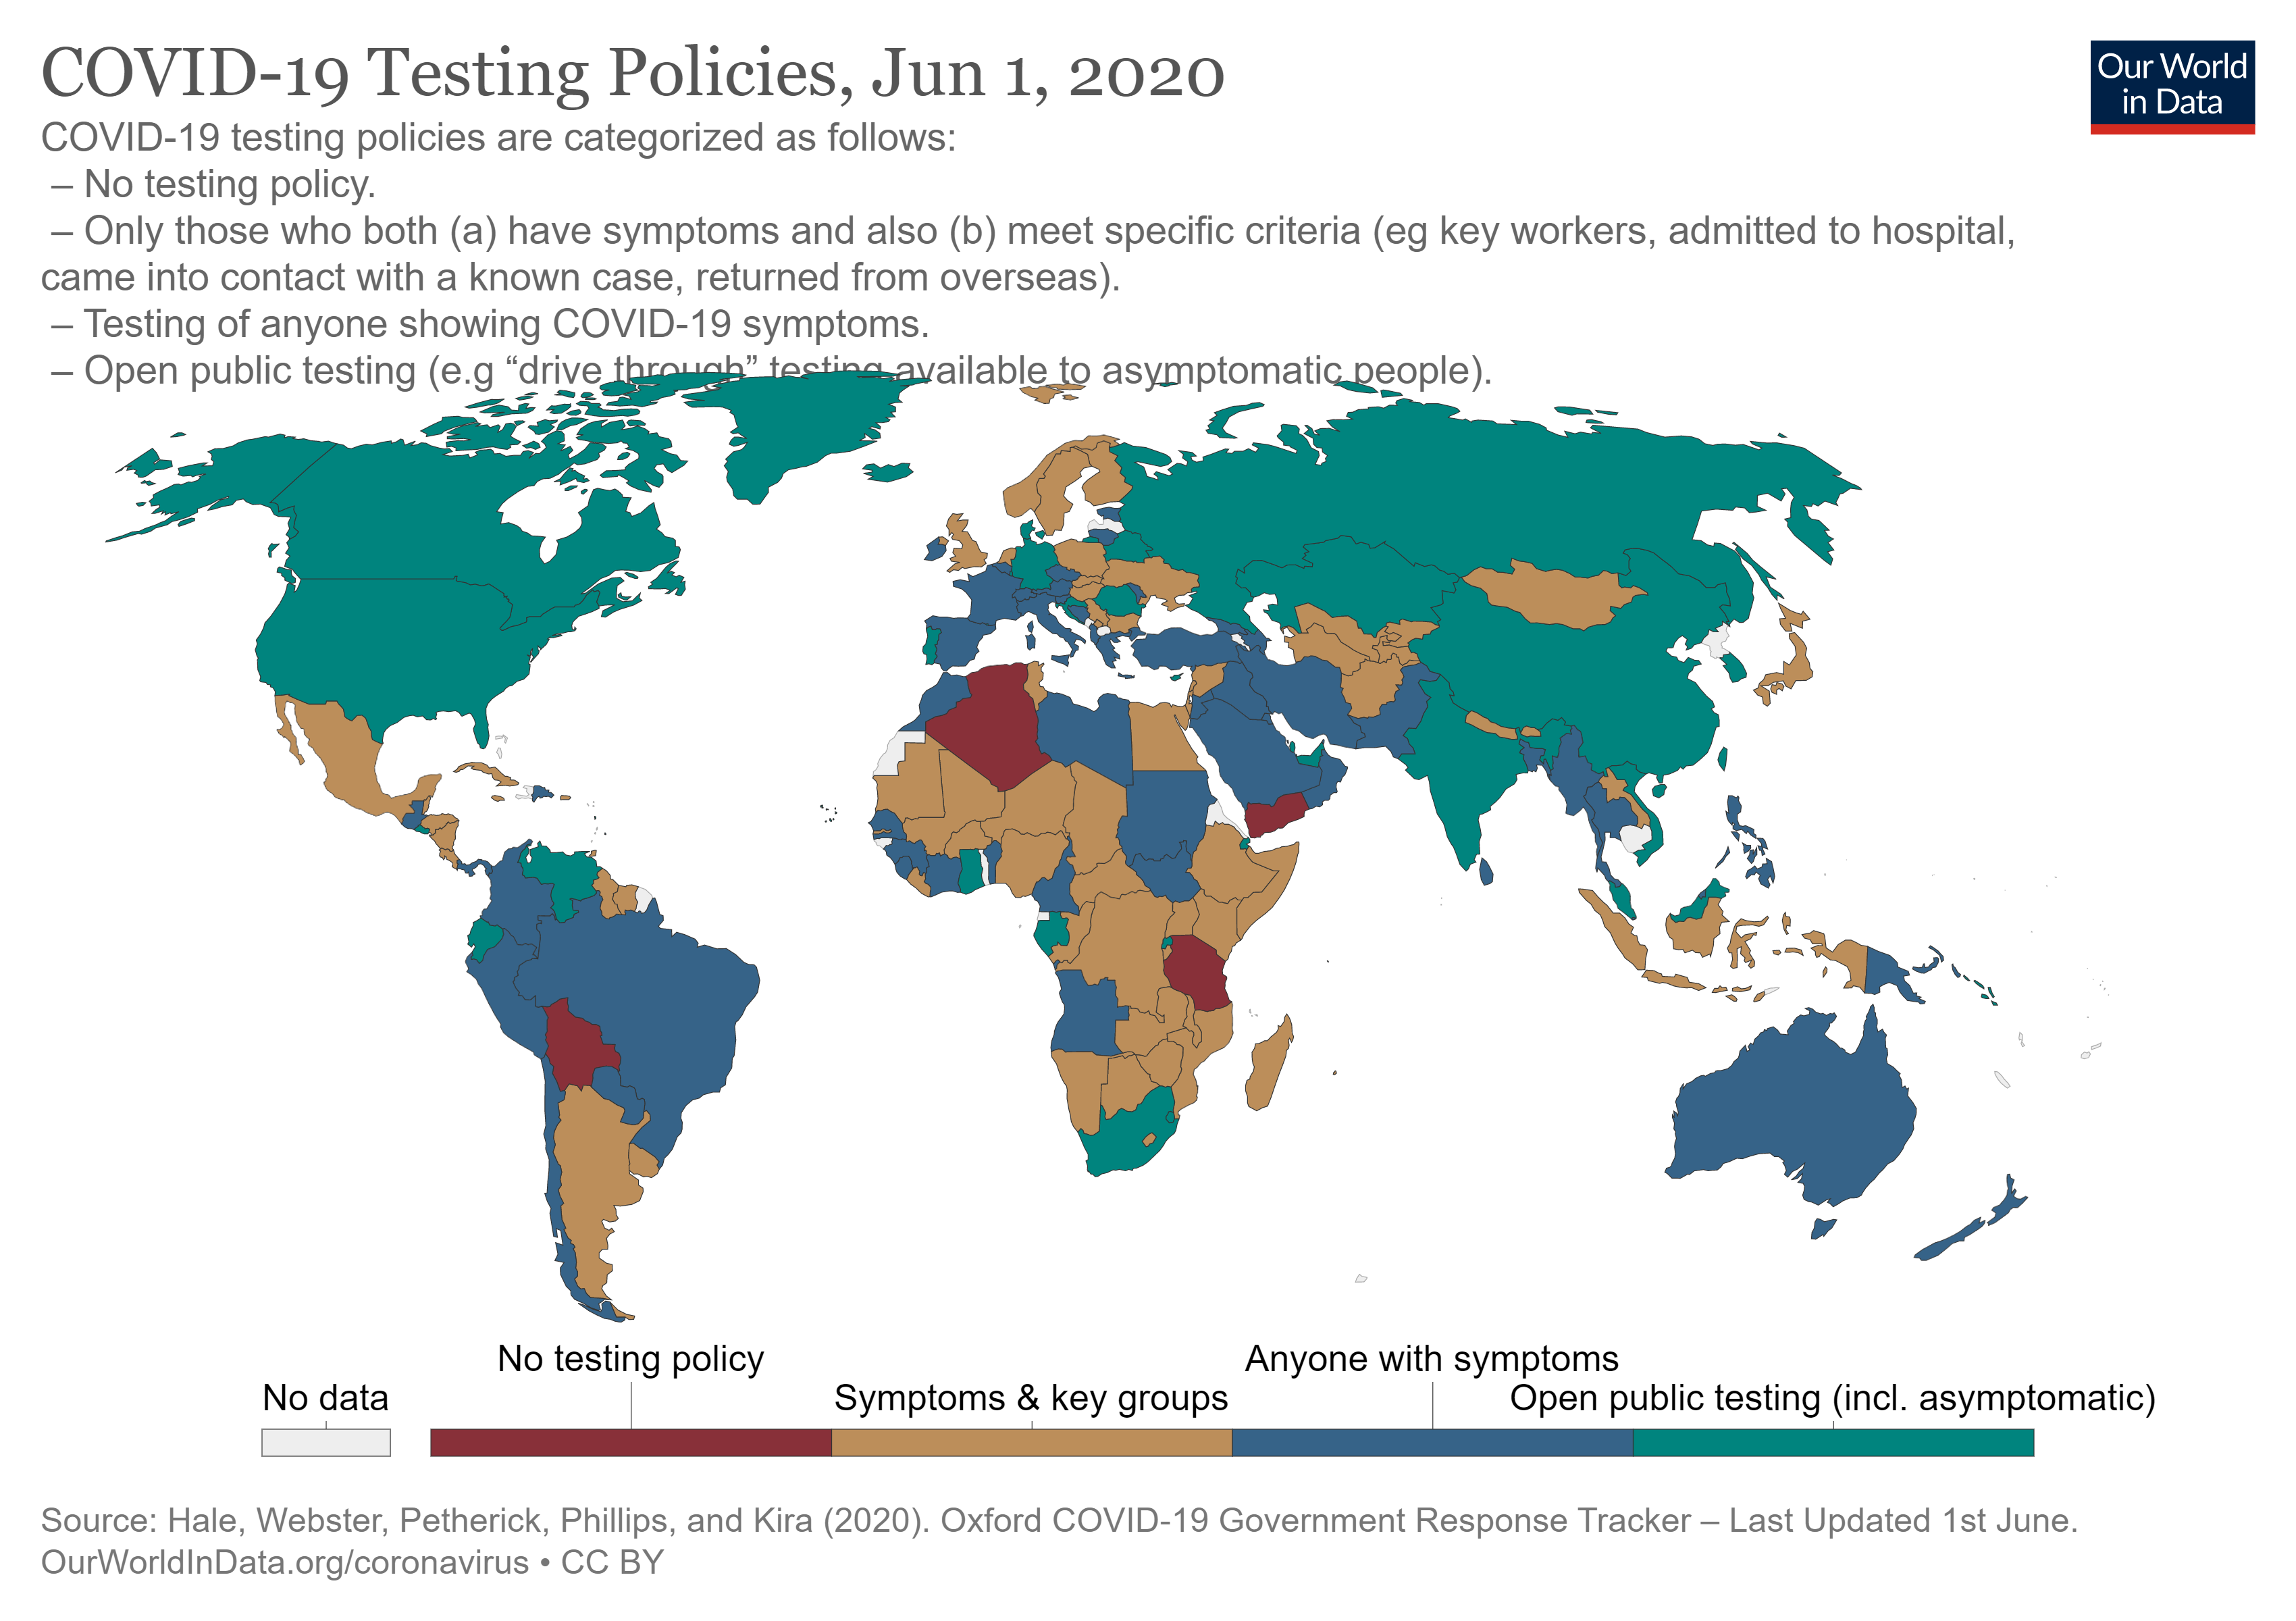
Figure 16: Covid-19 Testing Policies at 1 June
Covid-19 is so contagious that rapid reaction/response to help contain cluster outbreaks must be immediate.
If the information is not accurate, or delayed, or non-existent, people will die.
PROVINCES
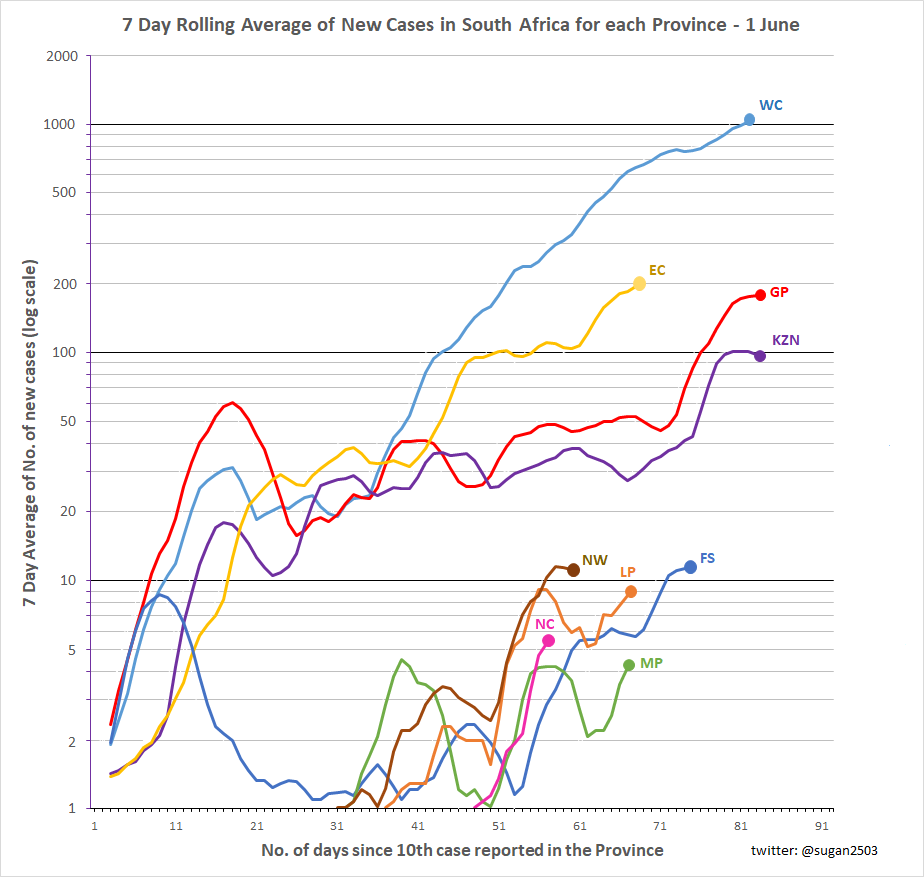
Figure 17: RSA Provincial rate of infection up to 1 June (recorded from 10th case in each province)
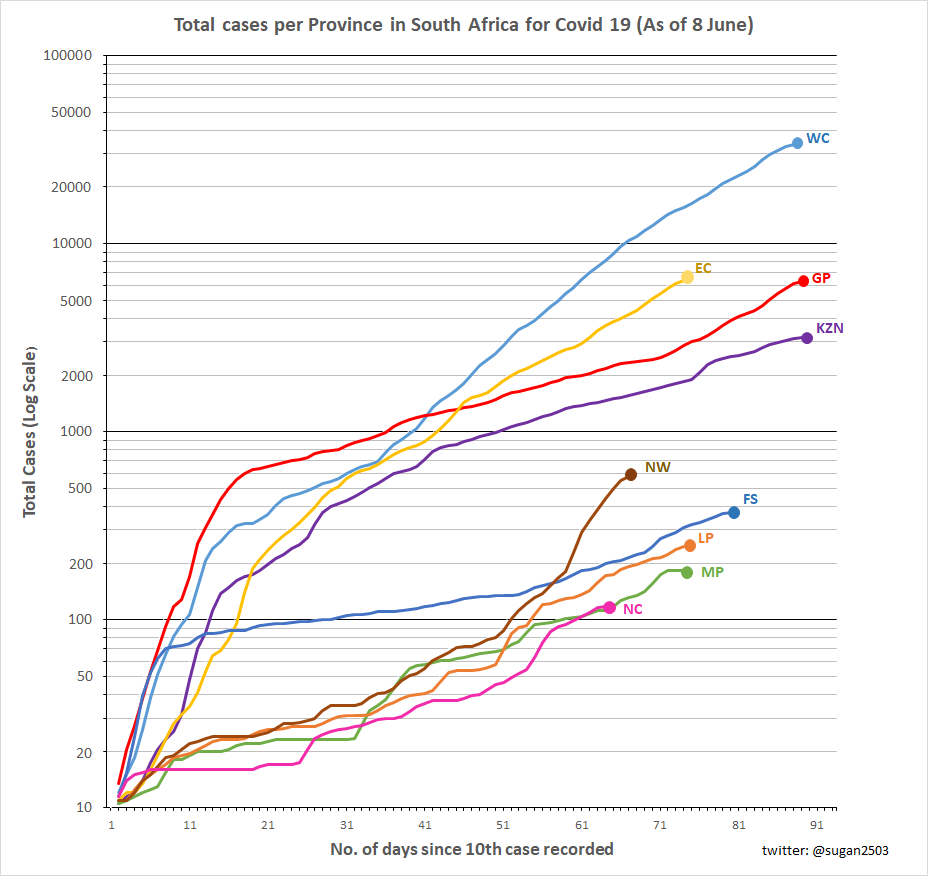
Figure 18: RSA Provincial total infections up to 8 June (recorded from 10th case in each province)
